Indications That The Earth Is Warming
Thousands of land and ocean temperature measurements are recorded each day around the globe. This includes measurements from climate reference stations, weather stations, ships, buoys and autonomous gliders in the oceans. These surface measurements are also supplemented with satellite measurements. These measurements are processed, examined for random and systematic errors, and then finally combined to produce a time series of global average temperature change. A number of agencies around the world have produced datasets of global-scale changes in surface temperature using different techniques to process the data and remove measurement errors that could lead to false interpretations of temperature trends. The warming trend that is apparent in all of the independent methods of calculating global temperature change is also confirmed by other independent observations, such as the melting of mountain glaciers on every continent, reductions in the extent of snow cover, earlier blooming of plants in spring, a shorter ice season on lakes and rivers, ocean heat content, reduced arctic sea ice, and rising sea levels.
| 1. |
Ten Indicators of a Warming Planet |
| 2. |
Temperature Anomaly Last Ten Thousand Years |
| 3. |
Global Temperature and Carbon Dioxide - 1880-2012 |
| 4. |
World Ocean Heat Content 0-700 m - 1955-2010 |
| 5. |
Total Heat Content (Oceans, Atmosphere, and Land) - 1960-2008 |
| 6. |
Sea Level Deviation - 1870-2010 |
| 7. |
Northern Hemisphere Snow Cover declined from 1966-2009 |
| 8. |
Total Glacier Ice Decline - 1860-2010 |
| 9. |
Arctic Sea Ice Volume Is Decreasing Rapidly |
| 10. |
Sea Surface Temperature - 1880-2012 |
Source: http://www.ncdc.noaa.gov/indicators/
This Fact Page displays text and images related to global warming and climate change
(Hover your mouse over the text below to "popup" a window with a related text.
Click on the text or image to open a new window with a detailed description.)
|
|
| Ten Indicators of a Warming Planet | 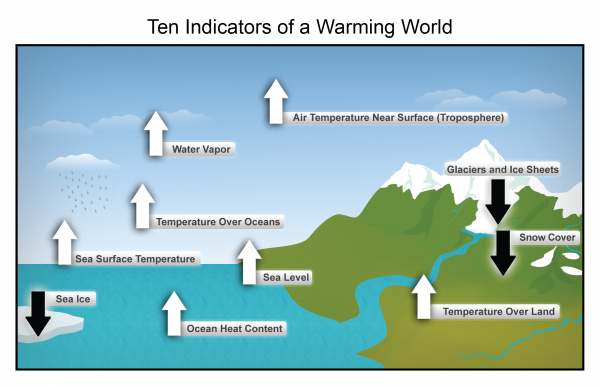
NOAA has published the State of the Climate 2009 report which defines 10 measurable planet-wide features used to gauge global temperature changes. All of these indicators are moving in the direction of a warming planet. | The 2009 State of the Climate report released today draws on data for 10 key climate indicators that all point to the same finding: the scientific evidence that our world is warming is unmistakable. More than 300 scientists from 160 research groups in 48 countries contributed to the report, which confirms that the past decade was the warmest on record and that the Earth has been growing warmer over the last 50 years.
Based on comprehensive data from multiple sources, the report defines 10 measurable planet-wide features used to gauge global temperature changes. The relative movement of each of these indicators proves consistent with a warming world. Seven indicators are rising: air temperature over land, sea-surface temperature, air temperature over oceans, sea level, ocean heat, humidity and tropospheric temperature in the “active-weather” layer of the atmosphere closest to the Earth’s surface. Three indicators are declining: Arctic sea ice, glaciers and spring snow cover in the Northern hemisphere. | | | Source: NOAA | URL: https://www.globalchange.gov/
(The text for the image(s) on this Web page was taken from the above source.) |
| Temperature Anomaly Last Ten Thousand Years | 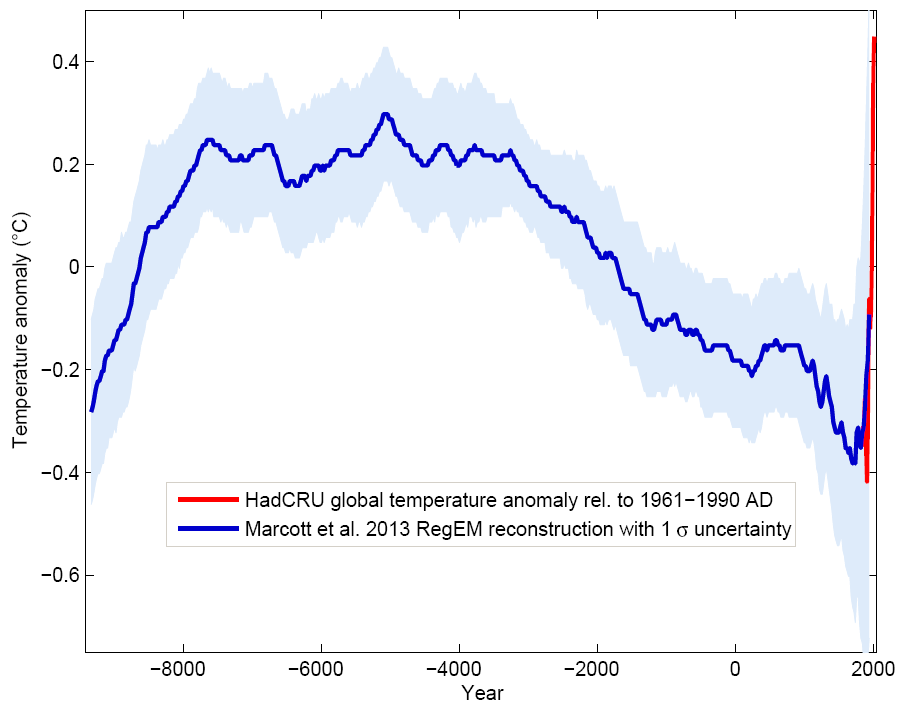
Blue curve: Global temperature reconstruction from proxy data of Marcott et al, Science 2013. Shown here is the RegEM version – significant differences between the variants with different averaging methods arise only towards the end, where the number of proxy series decreases. This does not matter since the recent temperature evolution is well known from instrumental measurements, shown in red (global temperature from the instrumental HadCRU data). Graph: Klaus Bitterman. - Click here for more information | The climate curve looks like a “hump”. At the beginning of the Holocene – after the end of the last Ice Age – global temperature increased, and subsequently it decreased again by 0.7 ° C over the past 5000 years. The well-known transition from the relatively warm Medieval into the “little ice age” turns out to be part of a much longer-term cooling, which ended abruptly with the rapid warming of the 20th Century. Within a hundred years, the cooling of the previous 5000 years was undone. - Click here for more information | | | Source: RealClimate | URL: http://www.realclimate.org/index.php/archives/2013/09/paleoclimate-the-end-of-the-holocene/
(The text for the image(s) on this Web page was taken from the above source.) |
| Global Temperature and Carbon Dioxide - 1880-2012 | 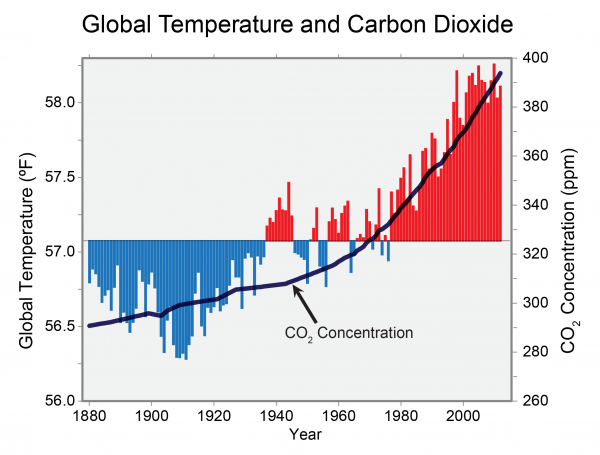
The Global Surface Temperature is Rising
Global annual average temperature measured over land and oceans. Red bars indicate temperatures above and blue bars indicate temperatures below the 1901-2000 average temperature. The black line shows atmospheric carbon dioxide concentration in parts per million. | Global average temperature is one of the most-cited indicators of global climate change, and shows an increase of approximately 1.4°F since the early 20th Century. The global surface temperature is based on air temperature data over land and sea-surface temperatures observed from ships, buoys and satellites. There is a clear long-term global warming trend, while each individual year does not always show a temperature increase relative to the previous year, and some years show greater changes than others. These year-to-year fluctuations in temperature are due to natural processes, such as the effects of El Ninos, La Ninas, and the eruption of large volcanoes. Notably, the 20 warmest years have all occurred since 1981, and the 10 warmest have all occurred in the past 12 years. | | | Source: NOAA | URL: https://www.globalchange.gov/
(The text for the image(s) on this Web page was taken from the above source.) |
| World Ocean Heat Content 0-700 m - 1955-2010 | 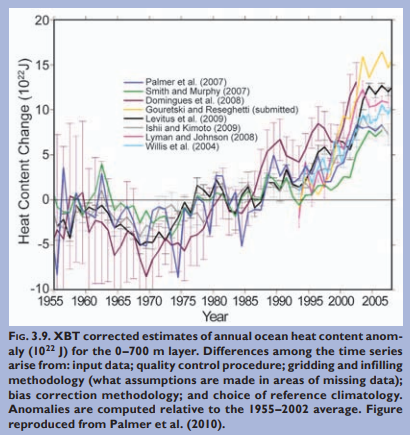
Global Upper Ocean Heat Content is Rising
Time series of seasonal (red dots) and annual average (black line) of global upper ocean heat content for the 0-700m layer since 1955. More information: BAMS State of the Climate in 2009. | While ocean heat content varies significantly from place to place and from year-to-year (as a result of changing ocean currents and natural variability), there is a strong trend during the period of reliable measurements. Increasing heat content in the ocean is also consistent with sea level rise, which is occurring mostly as a result of thermal expansion of the ocean water as it warms. | | | Source: NOAA | URL: https://www1.ncdc.noaa.gov/pub/data/cmb/bams-sotc/2009/bams-sotc-2009-chapter3-global-oceans-lo-rez.pdf
(The text for the image(s) on this Web page was taken from the above source.) |
| Total Heat Content (Oceans, Atmosphere, and Land) - 1960-2008 | 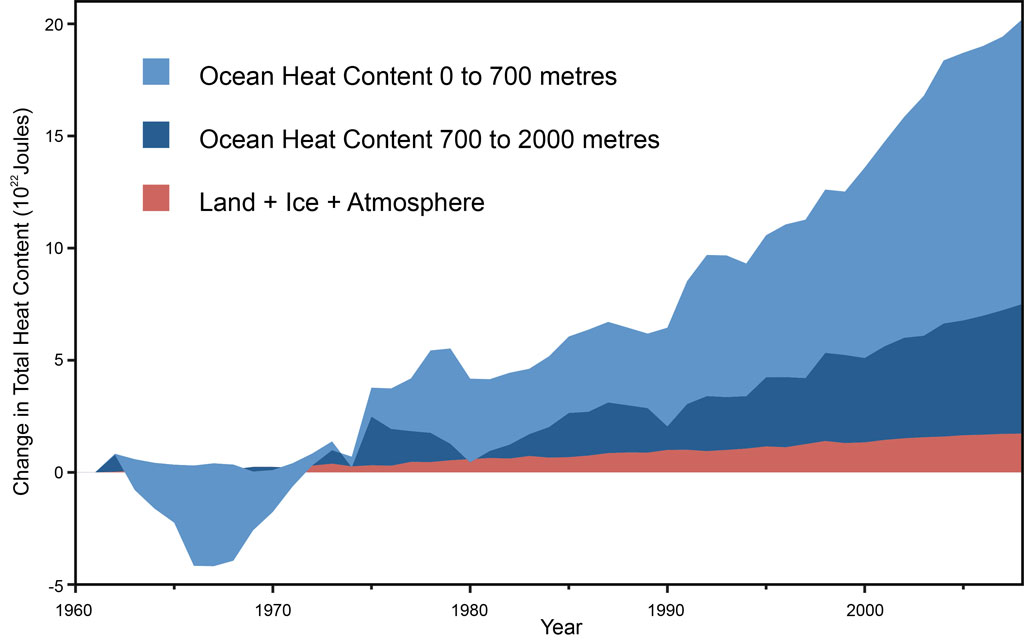
Land, atmosphere, and ice heating (red), 0-700 meter ocean heat content (OHC) increase (light blue), 700-2,000 meter OHC increase (dark blue). From Nuccitelli et al. (2012). | The total heat content of the Earth has been rising at a relatively costant pace since about 1965. Most of the heat (about 80%) has been absorbed by the oceans. | | | Source: Sceptical Science | | URL: http://www.skepticalscience.com/david-rose-hides-rise-global-warming.html |
| Sea Level Deviation - 1870-2010 |
Annual averages of global sea level. Red: sea-level since 1870; Blue: tide gauge data; Black: based on satellite observations. The inset shows global mean sea level rise since 1993 - a period over which sea level rise has accelerated. More information: Coastal Sensitivity to Sea Level Rise (USGCRP) and Climate Change 2007: The Physical Science Basis. | Global mean sea level has been rising at an average rate of approximately 1.7 mm/year over the past 100 years (measured from tide gauge observations), which is significantly larger than the rate averaged over the last several thousand years. Since 1993, global sea level has risen at an accelerating rate of around 3.5 mm/year. Much of the sea level rise to date is a result of increasing heat of the ocean causing it to expand. It is expected that melting land ice (e.g. from Greenland and mountain glaciers) will play a more significant role in contributing to future sea level rise. | | | Source: NOAA | URL: http://www.ncdc.noaa.gov/indicators/
(The text for the image(s) on this Web page was taken from the above source.) |
Northern Hemisphere Snow Cover declined from 1966-2009
| Northern Hemisphere Snow Cover - 1967 to 2016 | 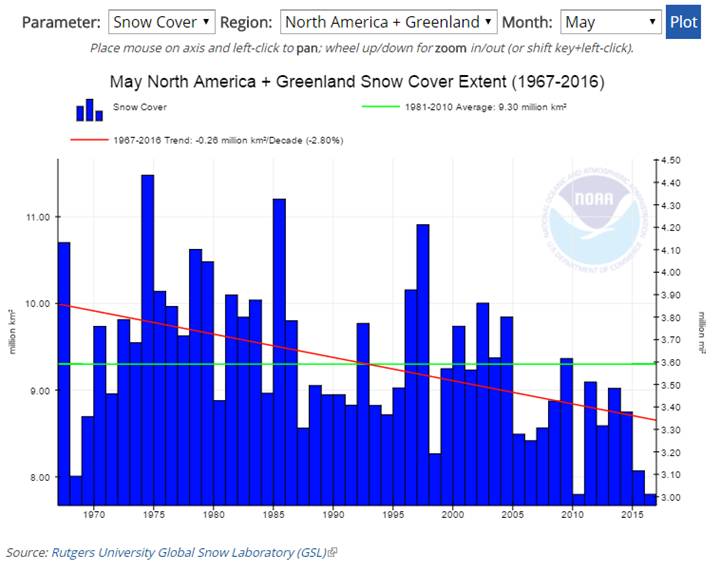
Northern Hemisphere Snow Cover is Retreating
Snow cover extent provided by the Rutgers University Global Snow Laboratory (GSL) is available from 1967–2016 for the North America + Greenland, Northern Hemisphere, Eurasia, and North America. All anomalies are relative to the 1981–2010 average. | Northern Hemisphere average annual snow cover has declined in recent decades. This pattern is consistent with warmer global temperatures. Some of the largest declines have been observed in the spring and summer months. | | | Source: NOAA | URL: http://www.ncdc.noaa.gov/indicators/
(The text for the image(s) on this Web page was taken from the above source.) |
| Total Glacier Ice Decline - 1860-2010 | 
Glacier Volume is Shrinking
Cumulative decline (in cubic miles) in glacier ice worldwide. Click Global Climate Change Impacts in the U.S.">here for more information | Warming temperatures lead to the melting of glaciers and ice sheets. The total volume of glaciers on Earth is declining sharply. Glaciers have been retreating worldwide for at least the last century; the rate of retreat has increased in the past decade. Only a few glaciers are actually advancing (in locations that were well below freezing, and where increased precipitation has outpaced melting). The progressive disappearance of glaciers has implications not only for a rising global sea level, but also for water supplies in certain regions of Asia and South America. | | | Source: NOAA | URL: https://downloads.globalchange.gov/usimpacts/pdfs/climate-impacts-report.pdf
(The text for the image(s) on this Web page was taken from the above source.) |
Arctic Sea Ice Volume Is Decreasing Rapidly
| Arctic Ice Volume in September - 1979-2013 | | As a result of the of the increased Arctic temperatures, the Arctic Ocean is losing very significant amounts of summertime ice volume (ice volume is a better indicator of the melting of the ice in summertime than ice area) | 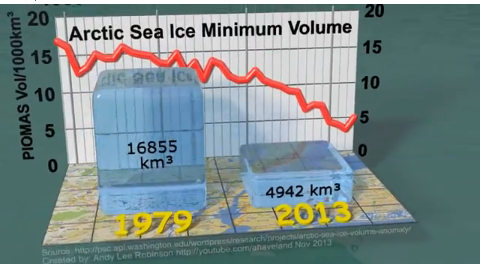
Artic sea ice volume has dropped far faster than coverage. In September the ice that remains is down by nearly 80% from its volume in 1980. At current pace of volume loss, the first ice-free Arctic day could come in just a few years. | Sea ice volume is a measurement of ice extent and its thickness. Understanding how fast the ice is being depleted by volume is crucial to working out how quickly we are approaching an ice-free Arctic summertime because thinner ice can be more vulnerable to future melting. As one expert noted, “there comes a point when large parts of the ice pack become so thin that it doesn't matter what the weather does…the train keeps chugging along, even when the weather isn't so great for melt”.
As with sea ice extent, volume appears to be in sharp decline in the Arctic. Although ice volume naturally increases and decreases during the seasons, scientists using the Pan-Arctic Ice Ocean Modelling and Assimilation System (PIOMAS) have identified that the amount of ice has been steadily falling since the 1970s.
In addition, the link between disappearing ice and temperature in modern times is now becoming much clearer. NOAA has said that the Arctic “has reached a new state…characterised by less sea ice (both extent and thickness),” adding that “the decline in total sea ice extent has been accompanied by an unprecedented loss of old, thick multiyear ice.”Or, as one commentator noted, Arctic sea ice loss is now “being driven by human emissions.Click here for the source | | | Source: ClimateState | | URL: http://climatestate.com/2013/11/22/arctic-sea-ice-minimum-volumes-1979-2013/ |
| Sea Surface Temperature - 1880-2012 | 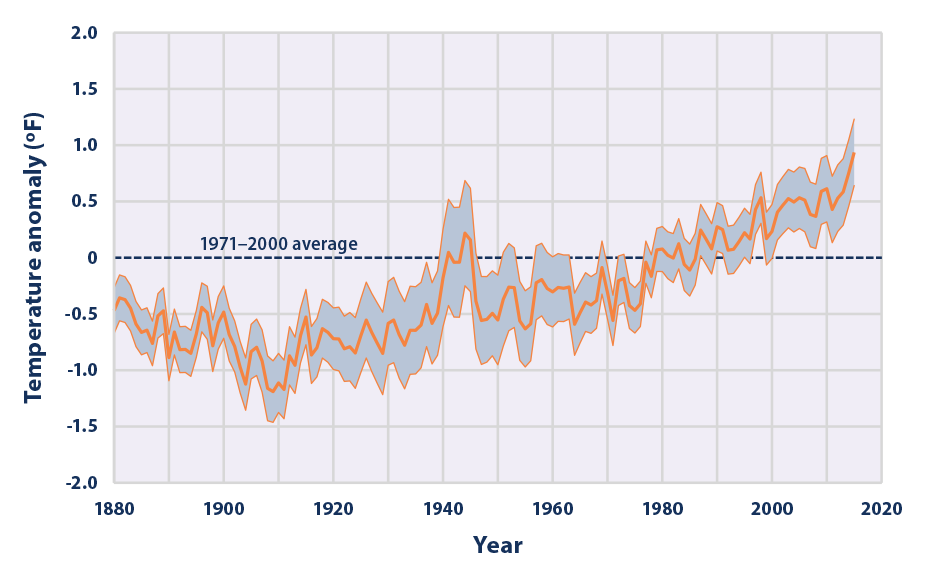
This graph shows how the average surface temperature of the world's oceans has changed since 1880. This graph uses the 1971 to 2000 average as a baseline for depicting change. Choosing a different baseline period would not change the shape of the data over time. The shaded band shows the range of uncertainty in the data, based on the number of measurements collected and the precision of the methods used. | The average surface temperature of the world's oceans has been increasing since about 1910. | | | Source: EPA | | URL: https://www.epa.gov/climate-indicators/climate-change-indicators-sea-surface-temperature |
|
|