 | .0.0.0 | Energy Innovation: How To Reach U.S. Net Zero Emissions By 2050 |
 | .0.0.0 | Energy Innovation: How To Reach U.S. Net Zero Emissions By 2050 | | | | Decarbonizing Electricity, Transportation, Buildings, and Industry |
|
| 1.0.0.0 | U.S. Statistics | | | | |
|
| 1.1.0.0 | U.S. GHG Emissions by Sector |
| 1.1.0.0 | U.S. GHG Emissions by Sector | | | | 2018 |
|
| 1.1.1.0 | images |
| 1.1.1.0 | images | | | | 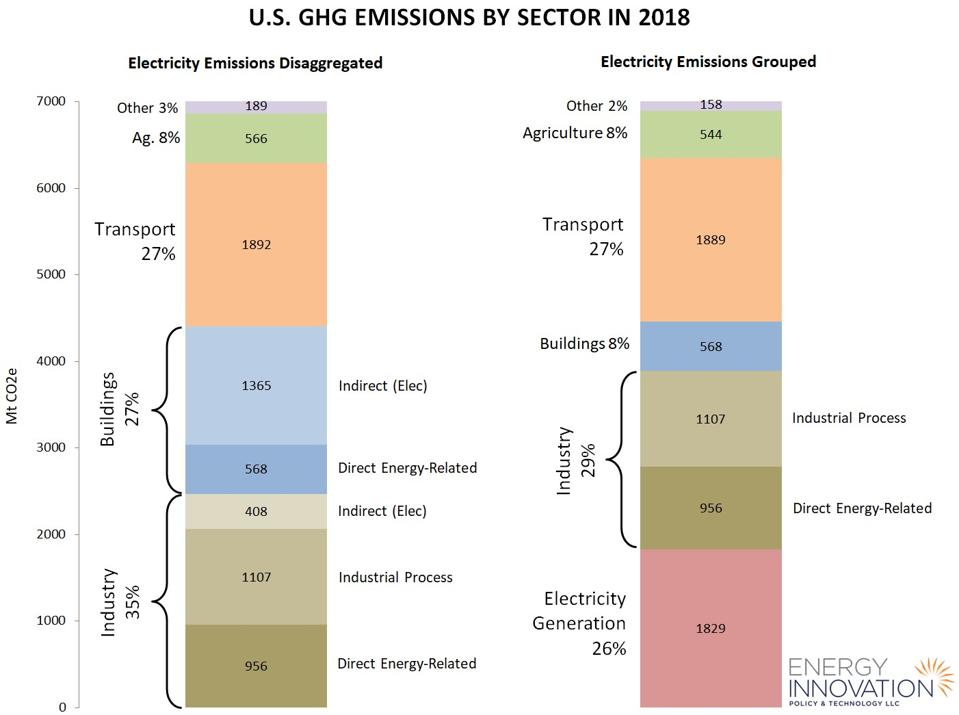 |
|
| 1.1.2.0 | details |
| 1.1.2.0 | details | | | | U.S. GHG Emissions by Sector in 2018, with electricity sector emissions assigned to demand , with electricity sector emissions assigned to demand sectors (left) or represented as a separate sector (right). ?Industry? includes manufacturing, construction, and the extraction, refining, and distribution of fossil fuels (including fugitive emissions from natural gas infrastructure). Fluorinated gas emissions are attributed to industry, which produced the gases, not to end users. ?Other? includes emissions from water treatment, waste (e.g. landfills), and dedicated district heat plants. ?Indirect? emissions are from the generation of purchased electricity. ?Industrial Process? emissions are non-energy GHG emissions from the creation of industrial products, such as CO2 released by the chemical breakdown of limestone to make cement. Data from the U.S. Energy Policy Simulator 2.0.0 |
|
| 2.0.0.0 | Electricity | | | | |
|
| 2.1.0.0 | U.S. electricity demand by sector in a business-as-usual scenario |
| 2.1.0.0 | U.S. electricity demand by sector in a business-as-usual scenario | | | | 2020-2050 |
|
| 2.1.1.0 | images |
| 2.1.1.0 | images | | | | 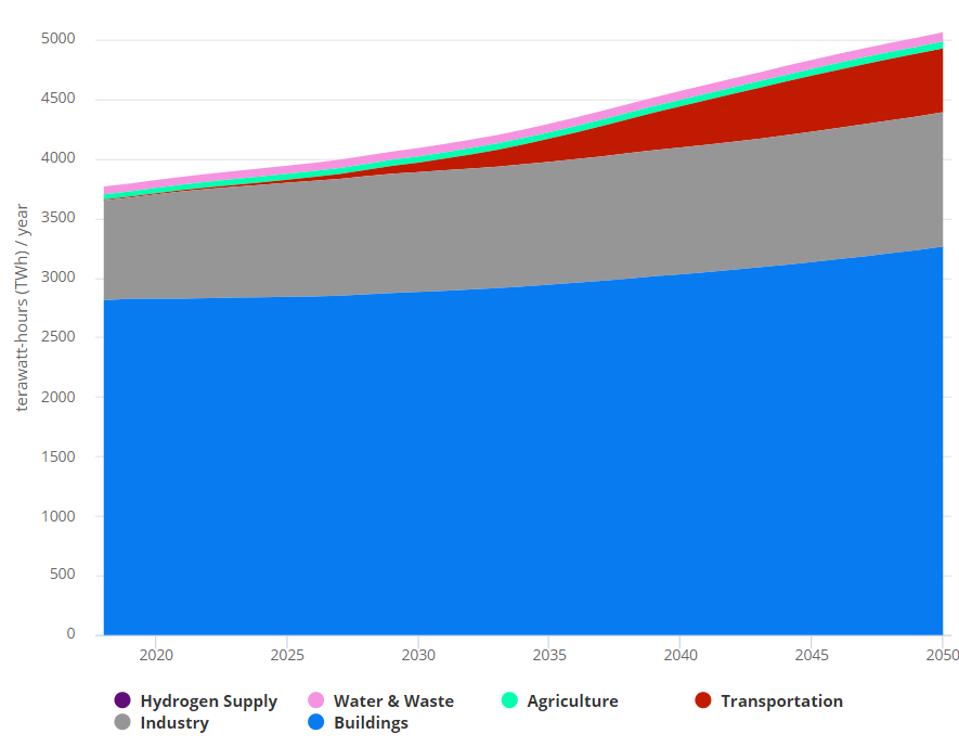 |
|
| 2.1.2.0 | details |
| 2.1.2.0 | details | | | | Today, most electricity is used in buildings (75%), followed by industry (22%). Transportation makes up a much smaller share at 0.2% but is expected to comprise a steadily growing share as electric vehicles gain market sharethrough 2050 (Figure 2). Overall electricity demand is also expected to increase in a business-as-usual scenario as building electrificationincreases and vehicles transition from fossil fuels to cleaner, more efficientelectric technologies |
|
| 2.2.0.0 | U.S. electricity generation by source in a business as usual scenario |
| 2.2.0.0 | U.S. electricity generation by source in a business as usual scenario | | | | 2020-2050 |
|
| 2.2.1.0 | images |
| 2.2.1.0 | images | | | | 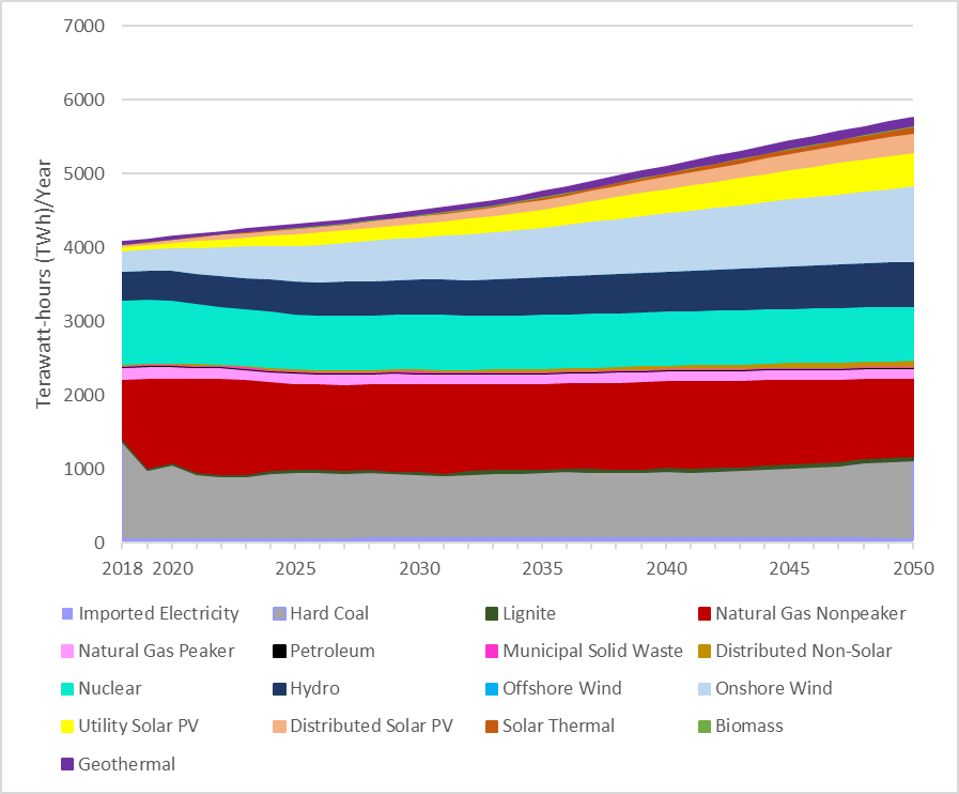 |
|
| 2.2.2.0 | details |
|
| 2.3.0.0 | Policies' contribution to abatement of U.S. electricity emissions in the net zero pathway |
| 2.3.0.0 | Policies' contribution to abatement of U.S. electricity emissions in the net zero pathway | | | | 2020-2050 |
|
| 2.3.1.0 | images |
| 2.3.1.0 | images | | | | 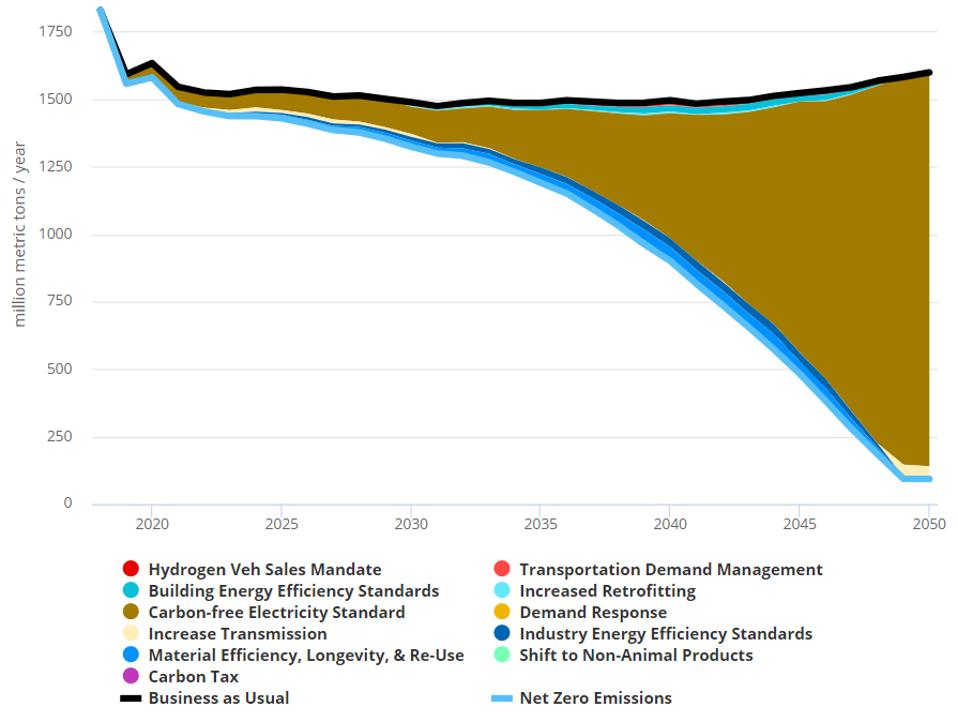 |
|
| 2.3.2.0 | details |
| 2.3.2.0 | details | | | | Achieving net zero energy emissionsby mid-century will require meeting electricity demand with low-carbon generation. Demand growth from electrifying buildings, vehicles, and certain industrial processes will further increase the need for zero-emission electricity. Figure 4 illustrates the reduction in electricity sector GHG emissions achieved due to each policy in the net zero pathway. |
|
| 2.4.0.0 | Policies' contribution to abatement of U.S. electricity emissions in the net zero pathway - Detail |
| 2.4.0.0 | Policies' contribution to abatement of U.S. electricity emissions in the net zero pathway - Detail | | | | Carbon-free electricity provides 85% of the abatement |
|
| 2.4.1.1 | Carbon-free electricity standard (85% of abatement) |
| 2.4.1.1 | Carbon-free electricity standard (85% of abatement) | | | | Many policy options exist for decarbonizing U.S. electricity generation, but the most effective are clean energy standards (CES) or renewable portfolio standards(RPS). These policies require a certain share of generation to come from zero-carbon electricity by a specific date. As states and regions begin to set standards in the 80-100% range, they have generally shifted to ?clean? energy rather than ?renewable? energy standards. This broadens the qualifying resources to include hydro, nuclear, or any other zero-carbon electricity source that can win on cost in the marketplace to begin operation before the policy end-date. To fully decarbonize electricity generation, the net zero pathway sets a 100% CES by 2050. The challenge may seem daunting, but the U.S. is already at 38% clean electricity, and 29 states plus the District of Columbiahave already established an RPS or CES. Nine of these states, plus the District of Columbia and Puerto Rico, target 100% clean electricity by 2050 or earlier. But the U.S. can't fully rely on state-level action ? decarbonizing electricity generation will also require strong federal action, including reforming power marketsto remove barriers to clean electricity. |
|
| 2.4.1.2 | Complementary power sector policies |
| 2.4.1.2 | Complementary power sector policies | | | | Reaching 100% clean electricity becomes much easier when accompanied by a few key policies. Although the complementary power sector policiesdo not show significant emissions impact in Figure 4, they enable reliably achieving the 100% CES. These policies also reduce the number of new plants needed to meet demand, lowering overall costs. The first complementary policy is increasing transmission infrastructure to move electricity from where it's generated to where it's ultimately used. Adding more wind and solar benefits significantly from adding more transmission lines to bring electricity from the areas of highest wind and sun potential to the areas with electricity demand. Sitingand permitting challenges The second complementary policy is expanding grid flexibilityto help manage electricity demand by shifting when consumers use power, reducing peak demand, and deploying grid-scale storage. The net zero pathway incorporates more than 200 GW of demand response by 2050 ? about half the potentialidentified by the Federal Energy Regulatory Commission and less aggressive than the 200 GW by 2030 potentialidentified by The Brattle Group ? and encourages investments to spur an additional 5% annual battery storage capacity growth, allowing the grid to store clean electricity for when it's most needed. |
|
| 2.4.1.3 | Policies in other sectors (14%) |
| 2.4.1.3 | Policies in other sectors (14%) | | | | While decarbonizing electricity generation in the net zero pathway is driven by the CES and complementary policies, policies in industry, buildings, and transportationalso contribute by reducing electricity demand. Of these policies, the biggest impacts come from material efficiency, longevity, and re-use of industrial products; industrial energy efficiency standards; building efficiency standards; and transportation demand management. All of these policies lower electricity demand, which reduces electricity sector emissions. |
|
| 2.5.0.0 | U.S. electricity generation by source in the net zero pathway |
| 2.5.0.0 | U.S. electricity generation by source in the net zero pathway | | | | 2020-2050 |
|
| 2.5.1.0 | Link |
| 2.5.1.0 | Link | | | | https://www.forbes.com/sites/energyinnovation/2017/07/18/offshore-winds-investment-opportunity-economic-growth-with-emissions-reductions/#145d078b226f |
|
| 2.5.2.0 | images |
| 2.5.2.0 | images | | | | 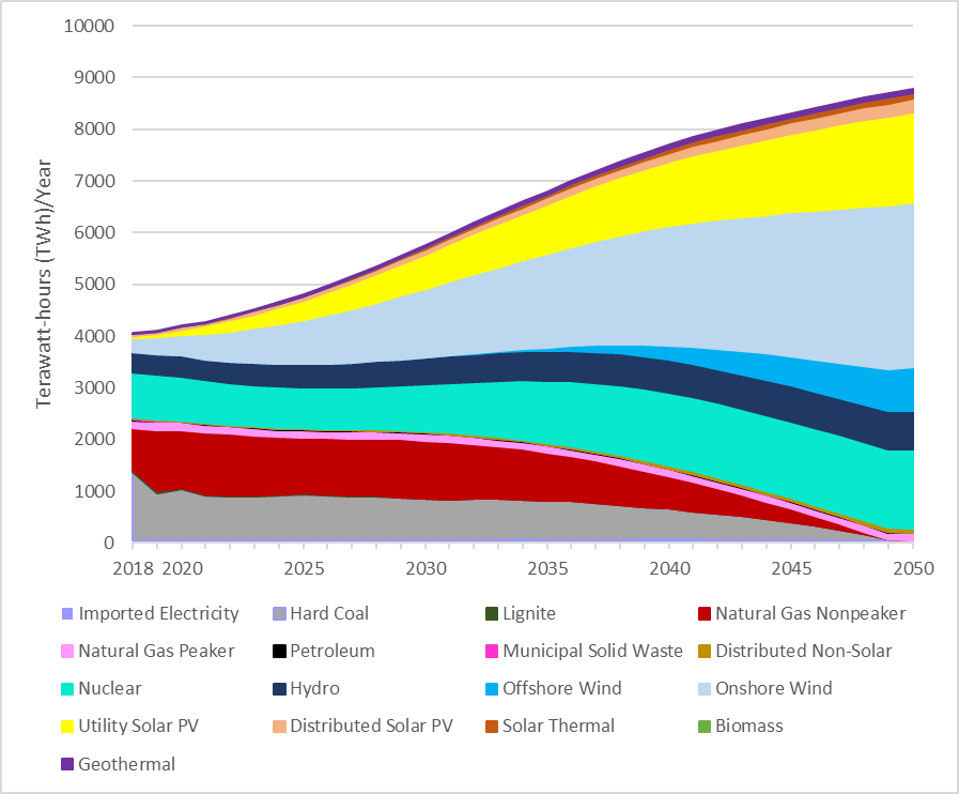 |
|
| 2.5.3.0 | details |
| 2.5.3.0 | details | | | | Clean electricity requires a step change in renewables The net zero policy pathway shifts electricity from mostly natural gas and coal to 70% wind and solar by 2050 (Figure 5), even as total electricity demand more than doubles due to aggressive electrification measures in other sectors. The most significant declines in natural gasand coal occur between 2045 and 2050, where decarbonization actually occurs ahead of the CES schedule as growth in electricity demand begins to slow and cheap renewables contribute the overwhelming majority of generation. |
|
| 2.6.0.0 | Changes in electricity generation capacity (compared to business-as-usual) in the net zero pathway |
| 2.6.0.0 | Changes in electricity generation capacity (compared to business-as-usual) in the net zero pathway | | | | 2020-2050 |
|
| 2.6.1.0 | images |
| 2.6.1.0 | images | | | | 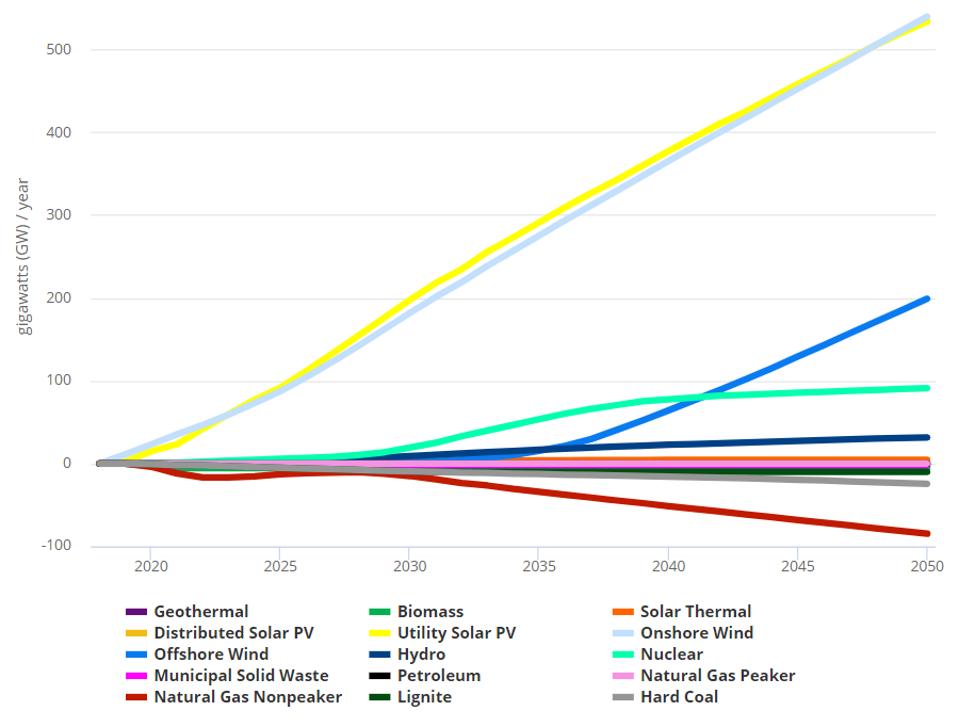 |
|
| 2.6.2.0 | details |
| 2.6.2.0 | details | | | | This step change in electricity generation requires significant new renewables capacity. Compared to business-as-usual, the net zero pathway adds about 750 GW wind and 550 GW solar by 2050. This increase in existing renewable generation capacity, which totaled only 95 GW wind and 30 GW solar in 2018, would require a massive construction campaign. This efforts would not be unprecedented ? the U.S. built 250,000 miles of rural power linesbetween 1935-1940 and added 10,400 miles to the interstate highway systembetween 1956-1961. And, the maximum required annual wind and solar installation rate, about 24 GW/year of each resource, is less than China's recent renewables installation rate. |
|
| 2.7.0.0 | Net zero power drives a clean economy |
| 2.7.0.0 | Net zero power drives a clean economy | | | | Decarbonizing electricity generation is critical to achieving net zero emissions. Not only does it contribute a quarter of today's emissions, but it helps decarbonize all other sectors, which rely upon electrification and hydrogen (produced with zero-carbon electricity) to transition off fossil fuels. |
|
| 2.7.1.0 | details |
| 2.7.1.0 | details | | | | Clearing the way for 100% clean electricity through a clean energy standard, complementary power sector policies, and controlling electricity demand growth, are linchpins of a decarbonized economy. |
|
| 3.0.0.0 | Transportation | | | | |
|
| 3.1.0.0 | Transportation CO2 Emissions by Vehicle Type - Business as usual |
| 3.1.0.0 | Transportation CO2 Emissions by Vehicle Type - Business as usual | | | | 2020-2050 |
|
| 3.1.1.0 | images |
| 3.1.1.0 | images | | | |  |
|
| 3.1.2.0 | details |
|
| 3.2.0.0 | Policies to reduce transportation emissions |
| 3.2.0.0 | Policies to reduce transportation emissions | | | | 2020-2050 |
|
| 3.2.1.0 | images |
| 3.2.1.0 | images | | | | 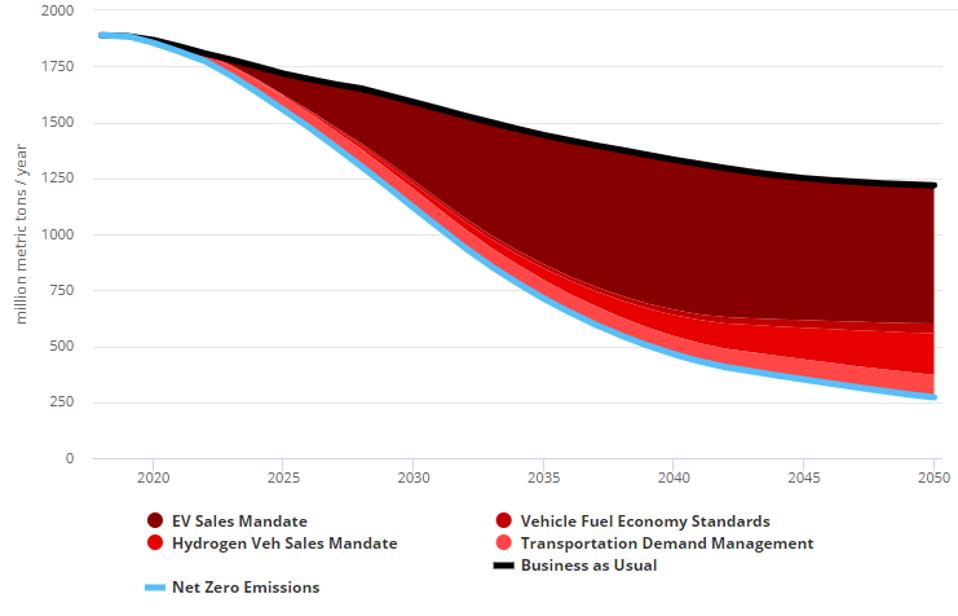 |
|
| 3.2.2.0 | details |
| 3.2.2.0 | details | | | | A number of policies can hasten the clean vehicle transition and encourage walking, biking, and public transit. Figure 3 depicts transportation sector emissions reductions caused by each measure in this net zero pathway. Transportation sector emissions do not reach zero in 2050, and in this net-zero scenario, the residual transportation sector emissions are counterbalanced by carbon sequestration in land use and forestry. |
|
| 3.3.0.0 | Policies to reduce transportation emissions- Details |
| 3.3.0.0 | Policies to reduce transportation emissions- Details | | | | Ordered from largest to smallest contribution to cumulative 2018-2050 emissions abatement in this net zero scenario: |
|
| 3.3.1.0 | Link |
| 3.3.1.0 | Link | | | | https://www.forbes.com/sites/energyinnovation/2019/10/07/how-hydrogen-could-become-a-130-billion-us-industry-and-cut-emissions-by-2050/#5eb7590d2849 |
|
| 3.3.2.0 | Link |
| 3.3.2.0 | Link | | | | https://www.energypolicy.solutions/policies/vehicle-performance-standards/ |
|
| 3.3.3.1 | Electric vehicle sales requirement (73% of abatement) |
| 3.3.3.1 | Electric vehicle sales requirement (73% of abatement) | | | | Today's vehicles primarily burn petroleum fuels that emit CO2, nitrogen oxides, and particulates, worsening global warming and contributing to lung disease, stroke, and premature death. Vehicles have long lifetimes: A typical car, SUV, or motorcycle may be operated for one or two decades; a medium/heavy truck or airplane for two or three decades; a rail locomotive or freight ship for three or four decades. Therefore, decarbonizing the transportation sector by 2050 requires phasing out sales of new, petroleum-burning vehiclesalmost immediately. (If a ban on new fossil fuel vehicle sales only comes into force in 2050, many polluting vehicles will still be on the roads in that year.) Accordingly, the net zero pathway requires 100% of all newly-sold cars, SUVs, motorcycles, buses, and rail locomotives, as well as 50% of medium- and heavy-duty trucks, to be all-electric via electric vehicle policiesby 2030. This is an extraordinarily aggressive timeline, but it is not unprecedented: Seven countries have announcedbans on new fossil fuel vehicles that take effect in 2030 or earlier, and a further five countries have announced bans that come into effect by 2050 (or in the case of China, no date has yet been set). Applying EV requirements to non-road vehicles is more difficult. Rail can be electrified with overhead catenary wires or a third rail, obviating the need for locomotives to carry batteries. Electrified rail networks carry passengers throughout Europe, China, and Japan, and electric freight locomotives operate in Europe, Russia, and China. Electricity may not be viablefor aviation or long-haul freight shipping, due to difficulties storing and carrying sufficient energy in batteries, so the EV sales mandateis not applied to these vehicles. |
|
| 3.3.3.2 | Transportation demand management (TDM, 13%) |
| 3.3.3.2 | Transportation demand management (TDM, 13%) | | | | TDM is an urban mobility policyrepresenting measures to shift travel from modes with large emissions intensity (light-duty passenger vehicles, freight trucks, and aircraft) to modes with zero- or low-emissions intensity (walking, biking, buses, rail, and ships). Component policies include: TDM's total GHG abatement is limited in the net zero pathway because most vehicle types transition to 100% clean energy by 2050. TDM will drive more emissions reductions if on-road vehicles are not using 100% clean energy by 2050, and even if the target is achieved, TDM lowers overall costs by reducing the number of vehicles that must be purchased and amount of electricity generation capacity that must be built by 2050. |
|
| 3.3.3.3 | Hydrogen vehicle sales mandate (12%) |
| 3.3.3.3 | Hydrogen vehicle sales mandate (12%) | | | | |
|
| 3.3.3.4 | Vehicle fuel economy or CO2emissions standards (3%) |
| 3.3.3.4 | Vehicle fuel economy or CO2emissions standards (3%) | | | | Standards only contribute a small share of emissions abatement in the net zero pathway because many of the vehicles covered by standards (on-road vehicles and rail) transition to 100% clean energy by 2050 due to the EV and hydrogen vehicle sales mandates. Standards will drive more emissions reductions if these vehicles are not using 100% clean energy by 2050, and even if the target is achieved, standards lower overall costs by reducing the amount of clean electricity generation capacity that must be built by 2050. In the net zero pathway, standards are also applied to aircraft and ships (25% and 20% fuel economy improvements, respectively, by 2040). These vehicles do not use clean energy in the net zero pathway, so standards are particularly important for them. |
|
| 3.4.0.0 | Transportation sector fuel use by fuel type in the net zero emissions scenario |
| 3.4.0.0 | Transportation sector fuel use by fuel type in the net zero emissions scenario | | | | 2020-2050 |
|
| 3.4.1.0 | images |
| 3.4.1.0 | images | | | | 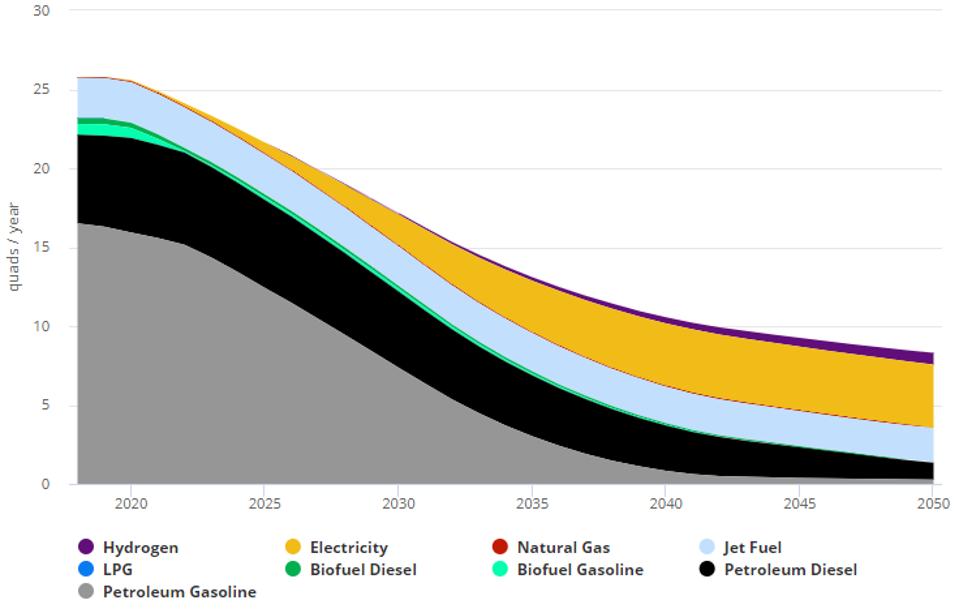 |
|
| 3.4.2.0 | details |
| 3.4.2.0 | details | | | | The net zero pathway reduces overall transportation sector energy use about two-thirds from 2018 to 2050, and well over half of the energy used in 2050 is zero-emission electricity or hydrogen. |
|
| 3.5.0.0 | U.S. transportation GHG emissions by vehicle type in the Net Zero Emissions scenario |
| 3.5.0.0 | U.S. transportation GHG emissions by vehicle type in the Net Zero Emissions scenario | | | | 2020-2050 |
|
| 3.5.1.0 | images |
| 3.5.1.0 | images | | | | 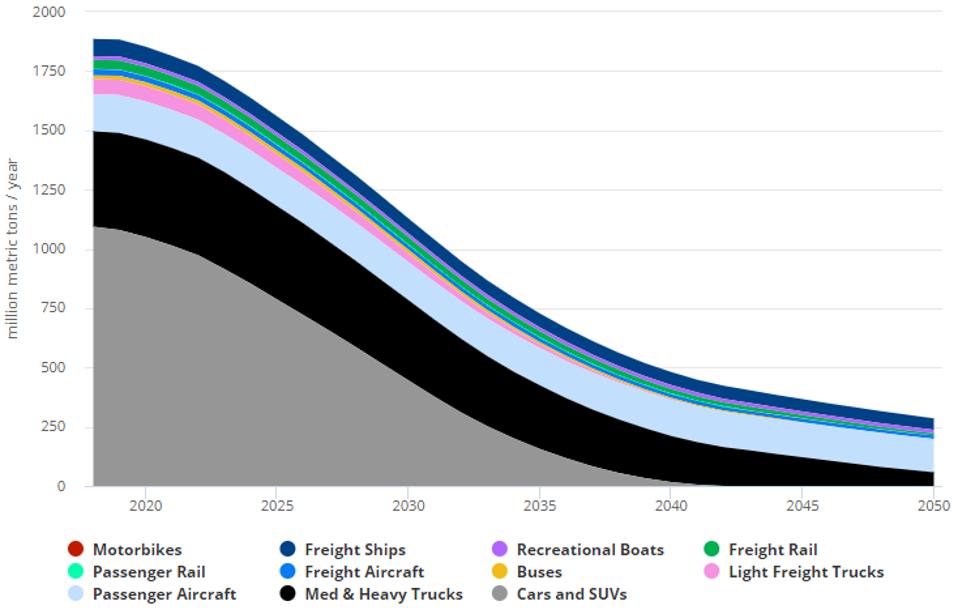 |
|
| 3.5.2.0 | details |
| 3.5.2.0 | details | | | | Under the net zero pathway, the remaining emissions come predominantly from aircraft, with a significant contribution from medium and heavy trucks, as their long lifetimes mean the fleet has not fully turned over after the 100% clean energy requirement took effect (Figure 5). Other vehicle types, particularly freight ships, also continue to emit GHGs through 2050. Mitigating remaining freight truck emissions simply requires allowing enough time post-2050 to complete the U.S. truck fleet turnover. Reducing aircraft emissions may be accomplished by strengthening international aircraft fuel economy standards, reducing air travel, and development and deployment of aviation biofuels. For ships, zero-carbon hydrogen or hydrogen-derived fuels are a promising technological route. |
|
| 3.6.0.0 | Achieving low-carbon transportation for net zero emissions |
| 3.6.0.0 | Achieving low-carbon transportation for net zero emissions | | | | Rapid transportation sector decarbonization is challenging due to long vehicle turnover times and the difficulty of using clean energy in certain non-road vehicles. Sales of most new, on-road fossil fuel vehicles must cease within approximately ten years for the U.S. to achieve zero net economy-wide emissions by 2050. But transforming U.S. transportation is possible, and the net zero pathway illustrates a set of policies that would enable the U.S. to achieve this very ambitious target. |
|
| 4.0.0.0 | Buildings | | | | |
|
| 4.1.0.0 | U.S. energy use in residential and commercial buildings, by component and building |
| 4.1.0.0 | U.S. energy use in residential and commercial buildings, by component and building | | | | 2019 |
|
| 4.1.1.0 | images |
| 4.1.1.0 | images | | | | 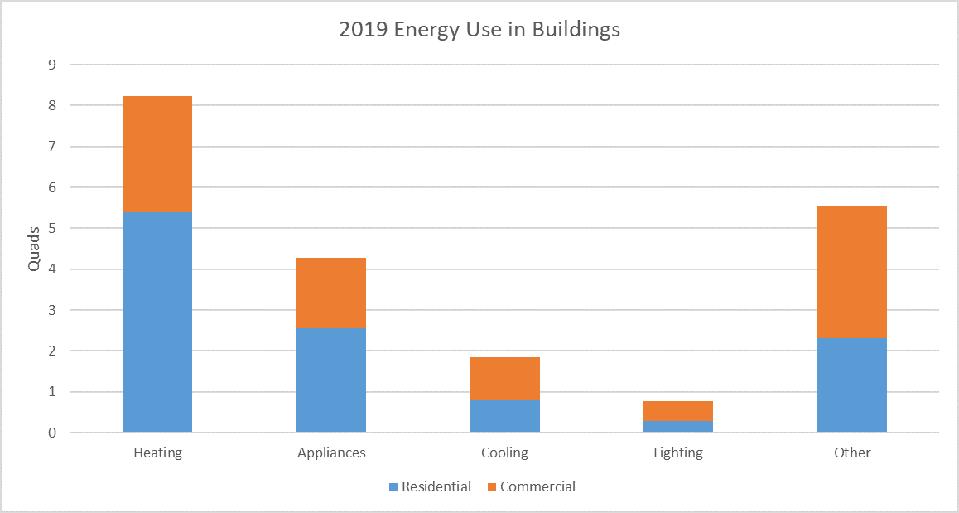 |
|
| 4.1.2.0 | details |
| 4.1.2.0 | details | | | | Today, total building energy use is evenly split between commercial buildings (45% of demand), urban residential buildings (44%), and rural residential buildings (11%). Heating is the largest source of energy demand at 40% of all energy used in buildings, although appliances and other components also constitute large shares (Figure 2). |
|
| 4.2.0.0 | U.S. energy use in buildings, by fuel type, in a business-as-usual pathway |
| 4.2.0.0 | U.S. energy use in buildings, by fuel type, in a business-as-usual pathway | | | | 2020-2050 |
|
| 4.2.1.0 | images |
| 4.2.1.0 | images | | | | 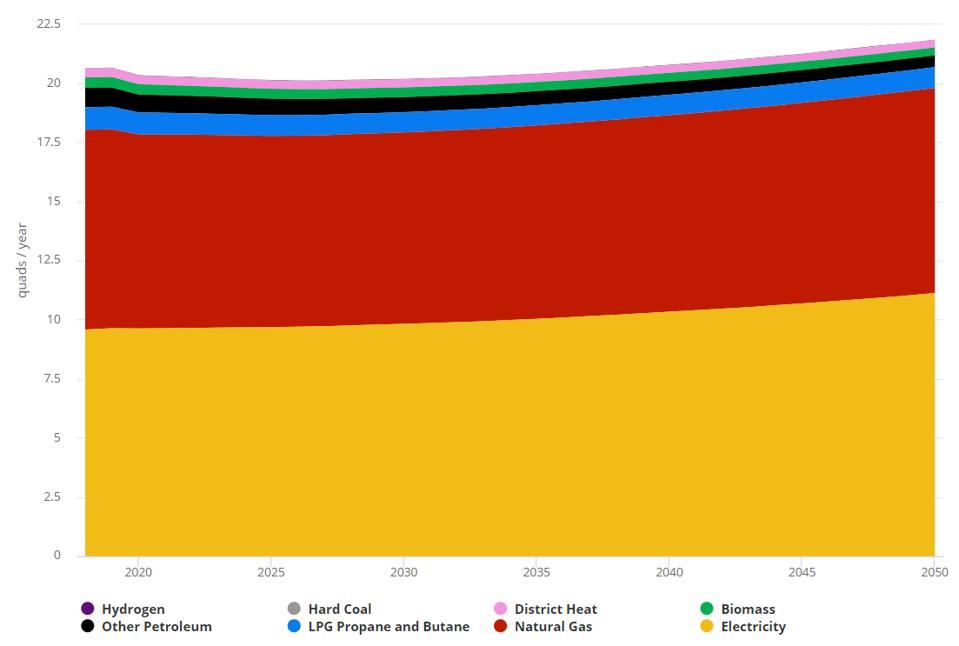 |
|
| 4.2.2.0 | details |
| 4.2.2.0 | details | | | | About 47% of energy consumed is buildings is provided by electricity, followed closely by natural gas at 41%. Remaining energy use comes from other petroleum products, biomass, and district heat (a centralized energy source that provides heat to multiple buildings). In a business-as-usual scenario, electricity use is projected to remain relatively flat, but increase slightly through 2050, while natural gas holds relatively steady (Figure 3). But continuing to rely on natural gas in our buildings locks in decades of emissions, leaky infrastructure, and public health risks from poor indoor air quality. |
|
| 4.3.0.0 | Policies to decarbonize U.S. buildings |
| 4.3.0.0 | Policies to decarbonize U.S. buildings | | | | 2020-2050 |
|
| 4.3.1.0 | images |
| 4.3.1.0 | images | | | | 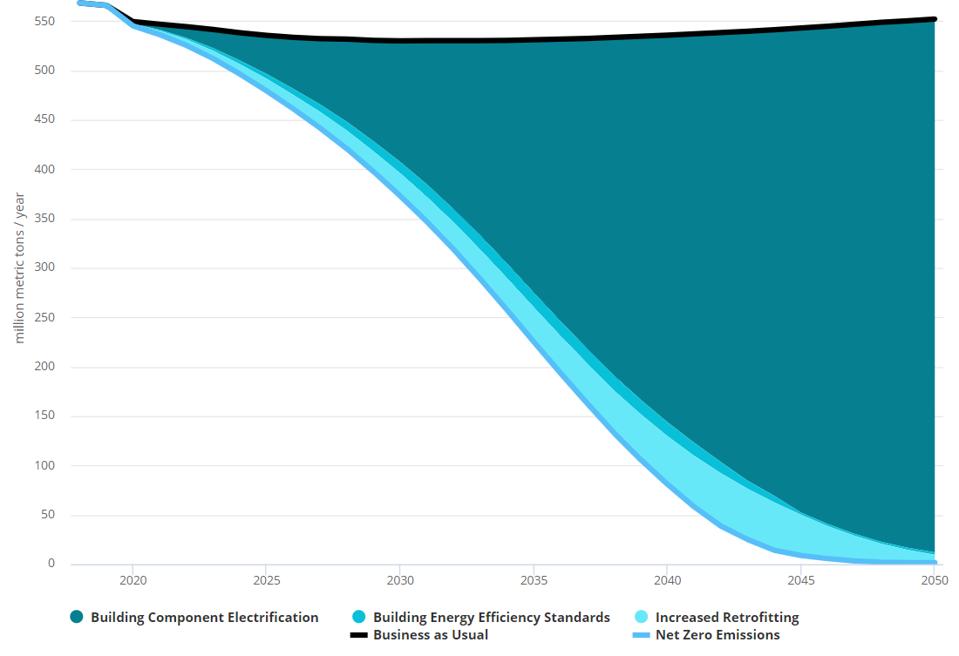 |
|
| 4.3.2.0 | details |
| 4.3.2.0 | details | | | | Various approaches can decarbonize buildings, but the most cost-effective and technologically feasible option is increasing the share of electric building components. However, decarbonizing buildings is challenging because building components take decades to turn over. For example, heaters ? the largest source of building energy demand ? last nearly 20 years, meaning a natural gas heater installed today will continue emitting GHGs until about 2040. This means the longer we wait to electrify building components, the longer it takes to cut building emissions, which makes early targets key to reaching net zero emissions by mid-century. Electric building components can already be cheaperthan natural gas equipment over component lifetimes, but up-front costs are still higher, requiring smart policy to accelerate the adoption of all-electric equipment. In the net zero policy pathway, an ambitious sales mandate requiring all-electric new equipment and appliance standardsby 2035 drives the overwhelming majority of emissions reductions in buildings ? a cumulative 8100 million metric tons of carbon dioxide equivalent (Mt CO2e) between 2020 and 2050 (Figure 4). Policy requiring new construction to be all-electric should be enacted as soon as possible to accelerate the process. |
|
| 4.4.0.0 | Policies to decarbonize U.S. buildings |
| 4.4.0.0 | Policies to decarbonize U.S. buildings | | | | 2020-2050 |
|
| 4.4.1.0 | details |
| 4.4.1.0 | details | | | | Forward-thinking cities are already heading down that path. Berkeley, California led the waywith its ban on natural gas pipes in many new buildings starting January 1, 2020 and other local governments in California, including San Francisco and Marin County, have adopted or are considering building electrificationordinances. States like Massachusettsand Maineare also implementing policies to accelerate building electrificationand reduce natural gas consumption in buildings. This trend could accelerate as more and more states and citiesset 100% clean electricity targets, which is at odds with continued natural gas pipeline expansion. Federal actions like midstream and upstream cash rebates (i.e., paid to installers, contractors, and distributors) for installing water and space heat pumps and induction cooktops, refundable tax credits, and low-cost financing for electrified building components could also help speed the transition. Retrofits are another important way to accelerate building stock turnover by increasing the efficiency of existing buildings. Most of the buildings that will still be standing in 2050 have already been built? but high costs dissuade owners from making efficiency upgrades that carry significant GHG abatement potential. A program offering financial incentives for retrofits, ideally targeting between 1% to 2% percent of U.S. homes and commercial buildings per year, is an ambitious but reasonable goal in line with targets in global building efficiency leader Germany. In the net zero policy pathway, retrofitting roughly 1% of homes and 1.5% of commercial buildings each year abates a cumulative 850 Mt CO2e. Improving new building and equipment efficiencyis the last critical piece to building decarbonization. The net zero policy pathway includes ambitious efficiency improvements for building envelopes (i.e., foundation, walls, roof) as well as all new equipment and appliances by 2050 ? anywhere from 11% to 40% depending on the component. Together, these efficiency gains abate a cumulative 250 Mt CO2e. Abatement from efficiency standards may seem low here because buildings transition to 100% clean electricity by 2050 in this scenario. Efficiency standards will drive greater GHG reductions if buildings fail to meet this ambitious target, and even if the target is reached, efficiency standards lower overall costs by reducing the amount of electricity generation capacity that must be built by 2050. A few strong policies could spur dramatic building efficiency improvements, starting with a federal green building code. While many jurisdictions already use model codes(building codeswritten and maintained by expert standard-setting bodies), the U.S. could go further by establishing its own, continuously improving ?green? model code incorporating both efficiency and low-carbon building materials. A green building code should also be complemented by bolstering federal appliance standards to ensure homes and businesses benefit from the most efficient equipment. States and cities should also be encouraged to set their own stronger building codes, and training builders and inspectors in best practices helps ensure all codes are appropriately implemented. Together, these policies could almost completely decarbonize U.S. buildings. Through 2050, building electrificationwould be responsible for 87% of the sector's cumulative emissions reductions. Retrofits at the rate modeled here would drive nearly 10% of mitigation, with efficiency upgrades contributing an additional 3%. |
|
| 4.5.0.0 | U.S. energy use in buildings, by fuel type |
| 4.5.0.0 | U.S. energy use in buildings, by fuel type | | | | 2020-2050 |
|
| 4.5.1.0 | images |
| 4.5.1.0 | images | | | | 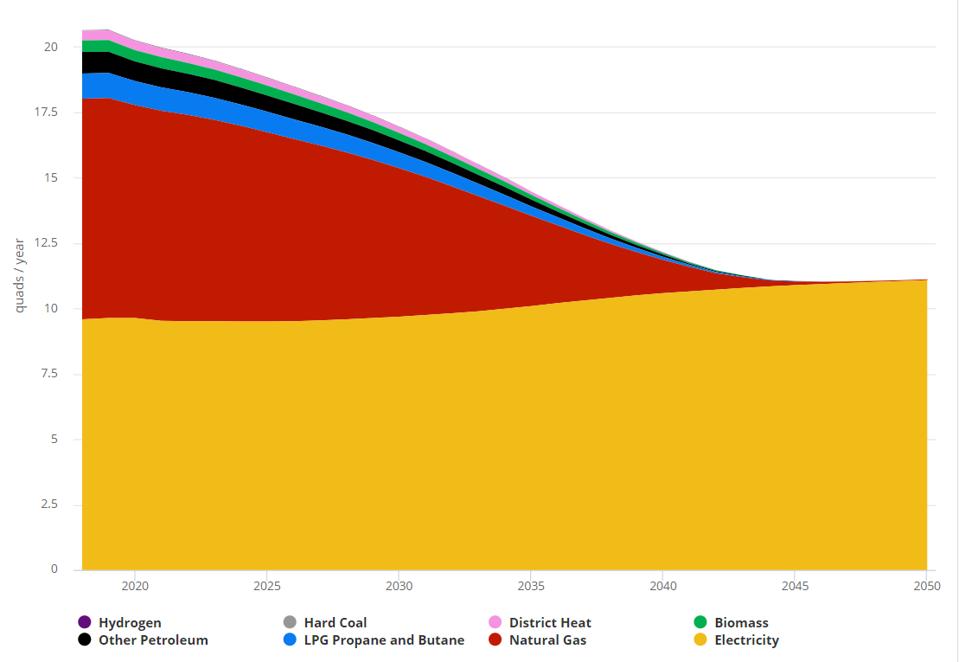 |
|
| 4.5.2.0 | details |
| 4.5.2.0 | details | | | | Electrifying American buildings drastically cuts their energy use and eliminates natural gas use in buildings, which is the primary driver of direct emissions. Because electric components are 65% - 70% more efficientthan natural gas equipment, efficiency gains from building code and appliance standards would cut overall energy use nearly 50% while maintaining the same level of comfort and service in America's buildings (Figure 5). |
|
| 4.6.0.0 | Early action is the key to building decarbonization |
| 4.6.0.0 | Early action is the key to building decarbonization | | | | The net zero policy pathway's ambitious efficiency policies limit electricity demand increases to roughly equivalent with electricity demand increase in business-as-usual (even with full building electrification), obviating the need for new electricity generation, saving money on power plant construction. |
|
| 4.6.1.0 | details |
| 4.6.1.0 | details | | | | Fast action on building sector decarbonization, both for new and existing buildings, is key to net zero emissions by 2050. Because building components last for decades, a rapid shift to all-electric equipment sales will ensure the U.S. electrifies its buildings at the necessary rate. Building efficiency retrofits, along with strong building codes and appliance standards, round out a building decarbonization strategy by curbing energy use and improving cost-effectiveness of the net zero pathway. |
|
| 5.0.0.0 | Industry | | | | |
|
| 5.1.0.0 | Direct emissions from U.S. Industry in a Business-as-Usual scenario |
| 5.1.0.0 | Direct emissions from U.S. Industry in a Business-as-Usual scenario | | | | ?2018-2050 |
|
| 5.1.1.0 | images |
| 5.1.1.0 | images | | | | 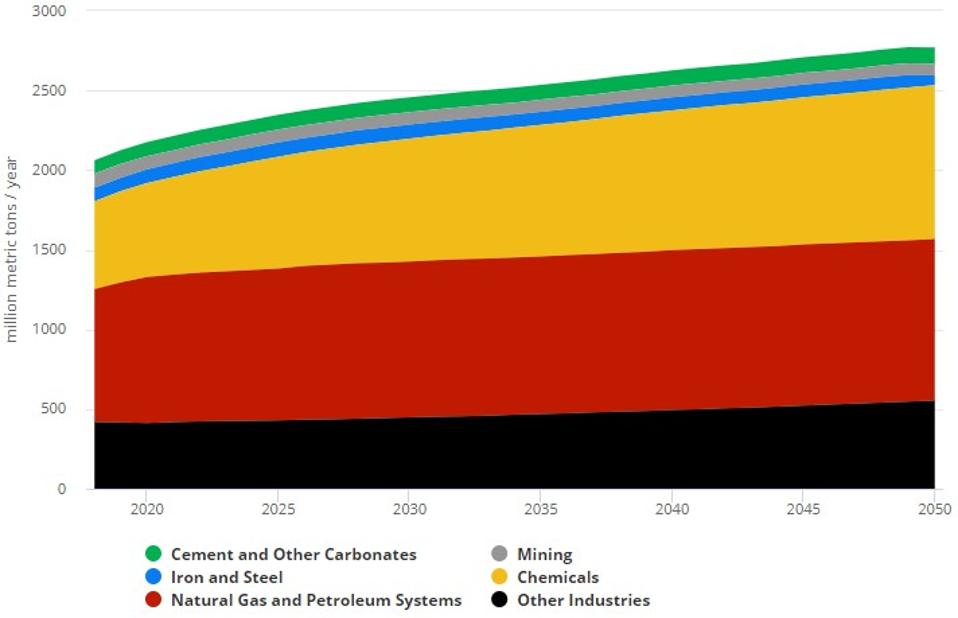 |
|
| 5.1.2.0 | details |
| 5.1.2.0 | details | | | | Without policy intervention, industrial emissions are projected to rise from just over 2,000 million metric tons (Mt) of carbon dioxide equivalent (CO2e) per year today to over 2,750 Mt CO2e/yr ? more than 35% ? by 2050 The most important contributor to these emissions is the natural gas and petroleum industry, responsible for 40% of direct industrial emissions in 2018. The second-largest contributor is the chemicals and plastics industry (27%). Other major contributors to U.S. industrial emissions are iron and steel (4%), coal mining (4%), and cement/concrete (4%). |
|
| 5.2.0.0 | Policies to decarbonize the industry sector |
| 5.2.0.0 | Policies to decarbonize the industry sector | | | | 2018-2050 |
|
| 5.2.1.0 | images |
| 5.2.1.0 | images | | | | 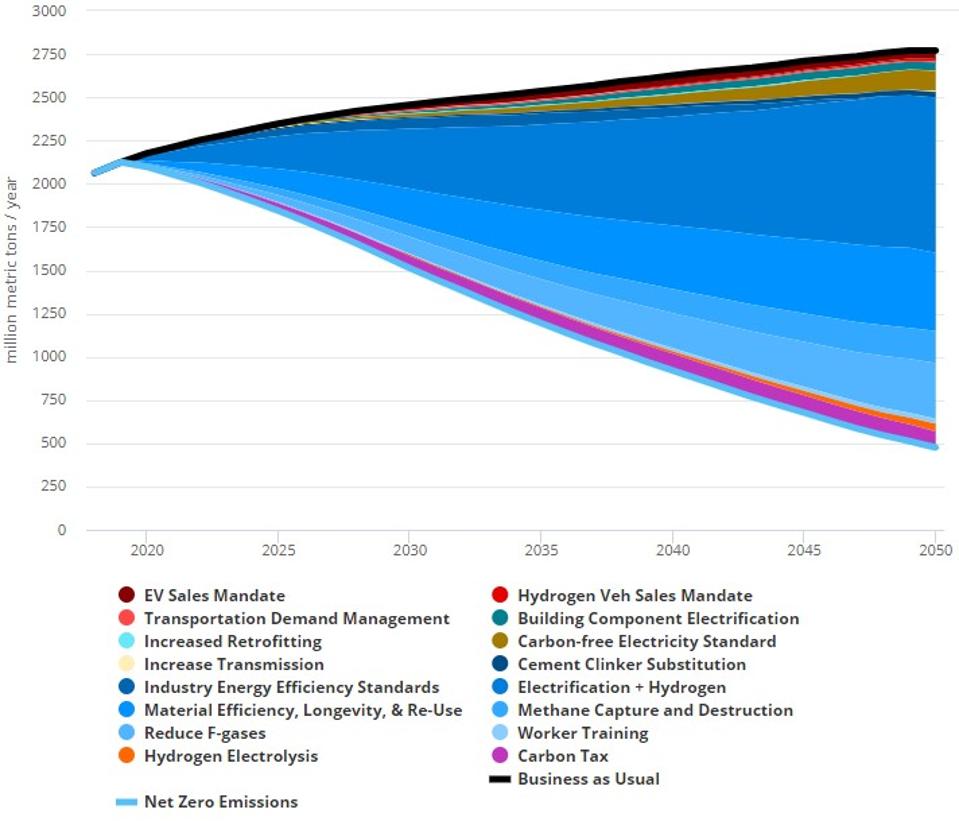 |
|
| 5.2.2.0 | details |
| 5.2.2.0 | details | | | | Fortunately, smart policies and technologies can decarbonize U.S. industry, as part of an economy-wide transformation that achieves zero net emissions by 2050. Figure 3 depicts industry sector emissions reductions caused by each measure in this illustrative net zero pathway as a colored wedge. Industry sector emissions do not reach zero in 2050, because some residual industry sector emissions are counterbalanced by carbon sequestration in the land use and forestry sector. |
|
| 5.3.0.0 | Policies to decarbonize the industry sector - Details |
| 5.3.0.0 | Policies to decarbonize the industry sector - Details | | | | Electrification and hydrogen? is 38% of the abatement |
|
| 5.3.1.1 | Electrification and hydrogen (38% of abatement) |
| 5.3.1.1 | Electrification and hydrogen (38% of abatement) | | | | Today's industries burn fossil fuels for a variety of needs, especially heating input materials and boilers, but tomorrow's industries must transition to zero-carbon fuel sources. Some industrial activities can be electrified, which eliminates energy-related emissions when on-site fuel burning is replaced with zero-carbon electricity. Certain processes are difficult or expensive to electrify due to requirements for high heat or chemical reactants, such as making virgin steel from iron ore. Hydrogencan be produced from zero-carbon electricity and used by industry as a thermal fuel and reactant in difficult-to-electrify processes. |
|
| 5.3.1.2 | Material efficiency, longevity, and re-use (21%) |
| 5.3.1.2 | Material efficiency, longevity, and re-use (21%) | | | | A large share of industrial emissions are associated with creating materials used in products, buildings, and infrastructure, such as concrete and steel. Smart design and precise use of material (enabled by technologies such as automation and 3D printing) can produce products delivering equal or better services while requiring less material. Improved designs and materials can also lengthen the useful lifetime of buildings or products, so they don't have to be replaced as often. Buildings and products can also be designed to facilitate re-use by a new owner, and approaches such as vehicle sharing may enable fewer vehicles to provide mobility services for more people. |
|
| 5.3.1.3 | Replace fluorinated gases (14%) |
| 5.3.1.3 | Replace fluorinated gases (14%) | | | | Fluorinated gases (F-gases) used as refrigerants, propellants, and electrical insulators can be replaced with more climate-friendly alternatives serving the same functions, such as propane, ammonia, isobutane, and various synthetic chemicals. The Montreal Protocol, an international treaty that phased out the use of refrigerants that damage the ozone layer in the 1990s-2000s, has now been extendedto similarly phase out F-gases that harm the climate. The U.S. must ratify this extension, which has strong bipartisan and business support, and would create economy-wide benefitsincluding manufacturing jobs and U.S. exports. |
|
| 5.3.1.4 | Methane capture and destruction (8%) |
| 5.3.1.4 | Methane capture and destruction (8%) | | | | Methane is the main component of natural gas, with a heat-trapping ability 28 times that of CO2per molecule over a 100-year timescale. Leaks from natural gas wellheads, pipelines, and equipment were responsible for 31% of U.S. methane emissionsin 2015 while and coal mining was responsible for another 9%. Better monitoring and prompt repair of natural gas leaks and systems to destroy methane leaking from coal mines (or phasing out coal mining) can help reduce these emissions. |
|
| 5.3.1.5 | Carbon tax (6%) |
| 5.3.1.5 | Carbon tax (6%) | | | | A tax on industry for every unit of GHGs via a well-designed carbon tax(or an equivalent cap-and-trade system) financially incentivizes firms to find innovative ways to reduce emissions, without specifying particular technologies that must be used. Industry is more sensitive to carbon pricing than other sectors, such as buildings (where split incentives and other market and information barrierscan prevent price signals from reaching decision makers). |
|
| 5.3.1.6 | Industry energy efficiency standards (3%) |
| 5.3.1.6 | Industry energy efficiency standards (3%) | | | | Industrial energy efficiencyinvestments reduce emissions and fuel expenditures, typically with short payback periods. There remains a great deal of untapped potential for efficiency improvementsthrough new technologies and increased adoption of best practice existing technologies (such as variable speed drives and highly efficient boilers with heat recovery). Designing entire systems for efficiency, rather than simply buying efficient individual components (motors, pumps, etc.), is a crucial strategy. Note that potential abatement from efficiency standards appears low (3%) in this policy pathway because industry transitions to 100% clean energy by 2050 in this net zero scenario. Efficiency standards will drive more emissions reductions if industry fails to meet the 100% clean energy target, and even if industry does achieve this target, efficiency standards lower overall costs by reducing the amount of clean energy generation capacity that must be built by 2050. |
|
| 5.3.1.7 | Other policies and technologies (12%) |
| 5.3.1.7 | Other policies and technologies (12%) | | | | Other industry sector policies included in the net zero policy pathway include reducing the share of highly-emitting materials used in cement and improved worker training. Some non-industry-sector policies also reduce industry sector emissions, generally by raising the price of industrial products, which slightly lowers demand for these products. These policies include a carbon-free electricity standard, an electric vehicle sales mandate, building electrification, and transitioning hydrogen production to electrolysis. (These policies cause more abatement from other sectors than they do from the industry sector, but only abatement of direct industrial emissions is shown in Figure 3.) |
|
| 5.4.0.0 | Reducing fuel use and residual emissions |
| 5.4.0.0 | Reducing fuel use and residual emissions | | | | 2018-2050 |
|
| 5.4.1.0 | images |
| 5.4.1.0 | images | | | | 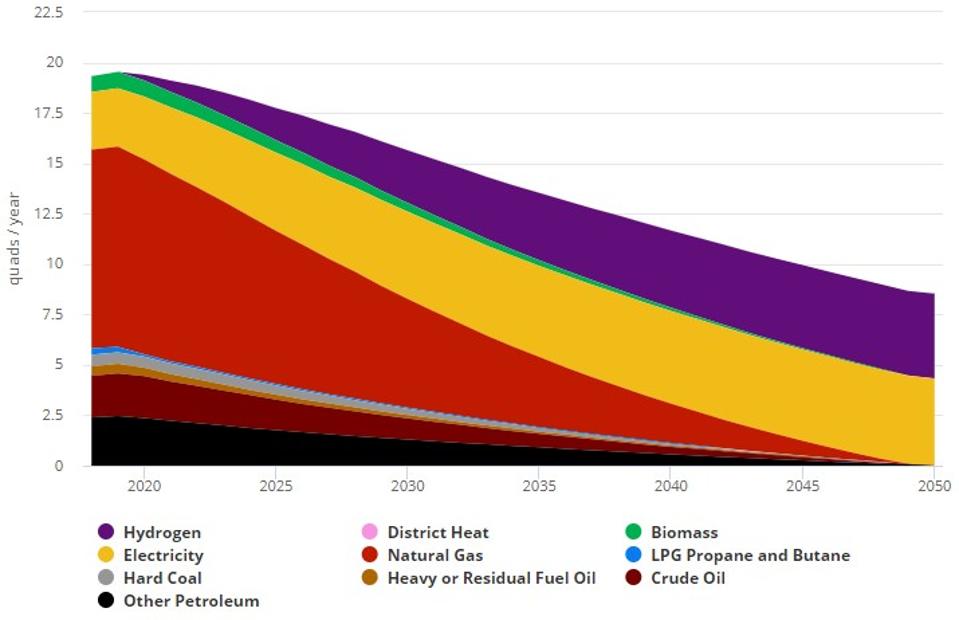 |
|
| 5.4.2.0 | details |
| 5.4.2.0 | details | | | | Reaching net zero emissions reduces overall industrial fuel use for energy purposes from about 19 quads/yr today to just under 9 quads/yr in 2050, while also transitioning to 100% electricity and hydrogen (Figure 4). Figure 4: U.S. industry fuel use by fuel in the Net Zero Emissions scenario, 2018-2050. This graph shows only fuel used for energy purposes, not chemical feedstocks |
|
| 5.5.0.0 | U.S. industry GHG emissions by pollutant |
| 5.5.0.0 | U.S. industry GHG emissions by pollutant | | | | 2018-2050 |
|
| 5.5.1.0 | images |
| 5.5.1.0 | images | | | |  |
|
| 5.5.2.0 | details |
| 5.5.2.0 | details | | | | Under the net zero pathway, remaining emissions are industrial process emissions, not energy-related emissions (Figure 5). The main sources of these residual emissions are CO2from cement production, methane leaks, and F-gas production and use. Eliminating these emissions may require new low-carbon cement chemistry, replacing concrete with other materials (such as wood), eliminating all methane leaks or phasing out natural gas production, and completing F-gas replacement with safer chemicals. |
|
| 5.6.0.0 | Achieving low-carbon industry for net zero emissions |
| 5.6.0.0 | Achieving low-carbon industry for net zero emissions | | | | 2018-2050 |
|
| 5.6.1.0 | details |
| 5.6.1.0 | details | | | | The industrial sector is a key partner in efforts to achieve net zero emissions. Manufacturers must produce the advanced materials, clean energy vehicles, and renewable electricity generation equipment that will be the cornerstone of a new energy economy, even as they find innovative ways to reduce their own emissions. The net zero pathway illustrates a combination of policies and technical measures that can cut industry emissions, helping to achieve a goal of economy-wide, net zero emissions in 2050. |
|