 | .0.0.0 | MACA - Group C |
 | .0.0.0 | MACA - Group C | | | | Useful Charts, Graphs, etc. |
|
| 1.0.0.0 | Mitigation |
| 1.0.0.0 | Mitigation | | | | Mitigation is the... |
|
| 1.1.0.0 | Stabilization Wedges (2011) |
| 1.1.0.0 | Stabilization Wedges (2011) | | | | Actions to reduce CO2 emissions |
|
| 1.1.1.0 | Link |
| 1.1.1.0 | Link | | | | https://undeerc.org/pcor/sequestration/co2wedges.aspx#DivideandConquerTheWedgeConcept |
|
| 1.1.2.0 | images |
| 1.1.2.0 | images | | | |  |
|
| 1.1.3.0 | details |
| 1.1.3.0 | details | | | | The CO2 wedge concept suggests ways in which we can apply today's technology to reduce CO2 emissions in large amounts called wedges. Each CO2 reduction wedge would be designed to prevent 92 billion tons of CO2 from entering the atmosphere over 50 years. When the concept was first proposed in 2004, seven wedges were needed to stabilize global CO2 emissions through 2054.7 In 2011, scientists revised the number to nine wedges to account for the higher global emission rate. If we start applying these actions now to create nine wedges, we could prevent 825 billion tons of CO2 from entering the atmosphere in 50 years. |
|
| 2.0.0.0 | Energy | | | | |
|
| 2.1.0.0 | Levelized Cost of Energy |
| 2.1.0.0 | Levelized Cost of Energy | | | | Historical Utility-Scale Cost Comparison |
|
| 2.1.1.0 | Link |
| 2.1.1.0 | Link | | | | https://intelli-products.com/ |
|
| 2.1.2.0 | images |
| 2.1.2.0 | images | | | |  |
|
| 3.0.0.0 | Energy Efficiency |
| 3.0.0.0 | Energy Efficiency | | | | |
|
| 3.1.0.0 | Transport Energy Efficiency (EN-ROADS) |
| 3.1.0.0 | Transport Energy Efficiency (EN-ROADS) | | | | highly increased - 5%/year |
|
| 3.1.1.0 | Link |
| 3.1.1.0 | Link | | | | https://en-roads.climateinteractive.org/scenario.html?p47=1.1&p50=5&v=2.7.19 |
|
| 3.1.2.0 | images |
| 3.1.2.0 | images | | | |  |
|
| 3.1.3.0 | images |
| 3.1.3.0 | images | | | |  |
|
| 3.1.4.0 | details |
| 3.1.4.0 | details | | | | Change from base case if this is the only option used Increase or decrease the energy efficiency of vehicles, shipping, air travel, and transportation systems. Energy efficiency includes things like hybrid cars, expanded public transport, and ways that people can get around using less energy. Adopting more energy efficient practices can improve public health and save money. |
|
| 3.2.0.0 | Transport Energy Efficiency (EN-ROADS) |
| 3.2.0.0 | Transport Energy Efficiency (EN-ROADS) | | | | Discouraged- decreases 1%/year |
|
| 3.2.1.0 | Link |
| 3.2.1.0 | Link | | | | https://en-roads.climateinteractive.org/scenario.html?p50=-1&v=2.7.19 |
|
| 3.2.2.0 | images |
| 3.2.2.0 | images | | | |  |
|
| 3.2.3.0 | images |
| 3.2.3.0 | images | | | |  |
|
| 3.2.4.0 | details |
| 3.2.4.0 | details | | | | Change from base case if this is the only option used Increase or decrease the energy efficiency of vehicles, shipping, air travel, and transportation systems. Energy efficiency includes things like hybrid cars, expanded public transport, and ways that people can get around using less energy. Adopting more energy efficient practices can improve public health and save money. |
|
| 3.3.0.0 | Buildings and Industry Energy Efficiency (EN-ROADS) |
| 3.3.0.0 | Buildings and Industry Energy Efficiency (EN-ROADS) | | | | Highly increased - 5%/year |
|
| 3.3.1.0 | Link |
| 3.3.1.0 | Link | | | | https://en-roads.climateinteractive.org/scenario.html?p47=5&v=2.7.19 |
|
| 3.3.2.0 | images |
| 3.3.2.0 | images | | | |  |
|
| 3.3.3.0 | images |
| 3.3.3.0 | images | | | |  |
|
| 3.3.4.0 | details |
| 3.3.4.0 | details | | | | Change from base case if this is the only option used Increase or decrease the energy efficiency of buildings, appliances, and other machines. Energy efficiency includes things like building well-insulated homes and reducing the amount of energy factories use. Energy efficient practices can save money through reduced energy needs as well as improve the health of people in those buildings. |
|
| 3.4.0.0 | Buildings and Industry Energy Efficiency (EN-ROADS) |
| 3.4.0.0 | Buildings and Industry Energy Efficiency (EN-ROADS) | | | | Discouraged- decreases 1%/year |
|
| 3.4.1.0 | images |
| 3.4.1.0 | images | | | |  |
|
| 3.4.2.0 | images |
| 3.4.2.0 | images | | | |  |
|
| 3.4.3.0 | details |
| 3.4.3.0 | details | | | | Change from base case if this is the only option used Increase or decrease the energy efficiency of buildings, appliances, and other machines. Energy efficiency includes things like building well-insulated homes and reducing the amount of energy factories use. Energy efficient practices can save money through reduced energy needs as well as improve the health of people in those buildings. |
|
| 3.5.0.0 | Energy Efficiency Can Slash Emissions and Get US Halfway to Climate Goals |
| 3.5.0.0 | Energy Efficiency Can Slash Emissions and Get US Halfway to Climate Goals | | | | Carbon Dioxide Emission Reductions Relative to baseline |
|
| 3.5.1.0 | Link |
| 3.5.1.0 | Link | | | | http://www.nacleanenergy.com/articles/35688/energy-efficiency-can-slash-emissions-and-get-us-halfway-to-climate-goals |
|
| 3.5.2.0 | images |
| 3.5.2.0 | images | | | | 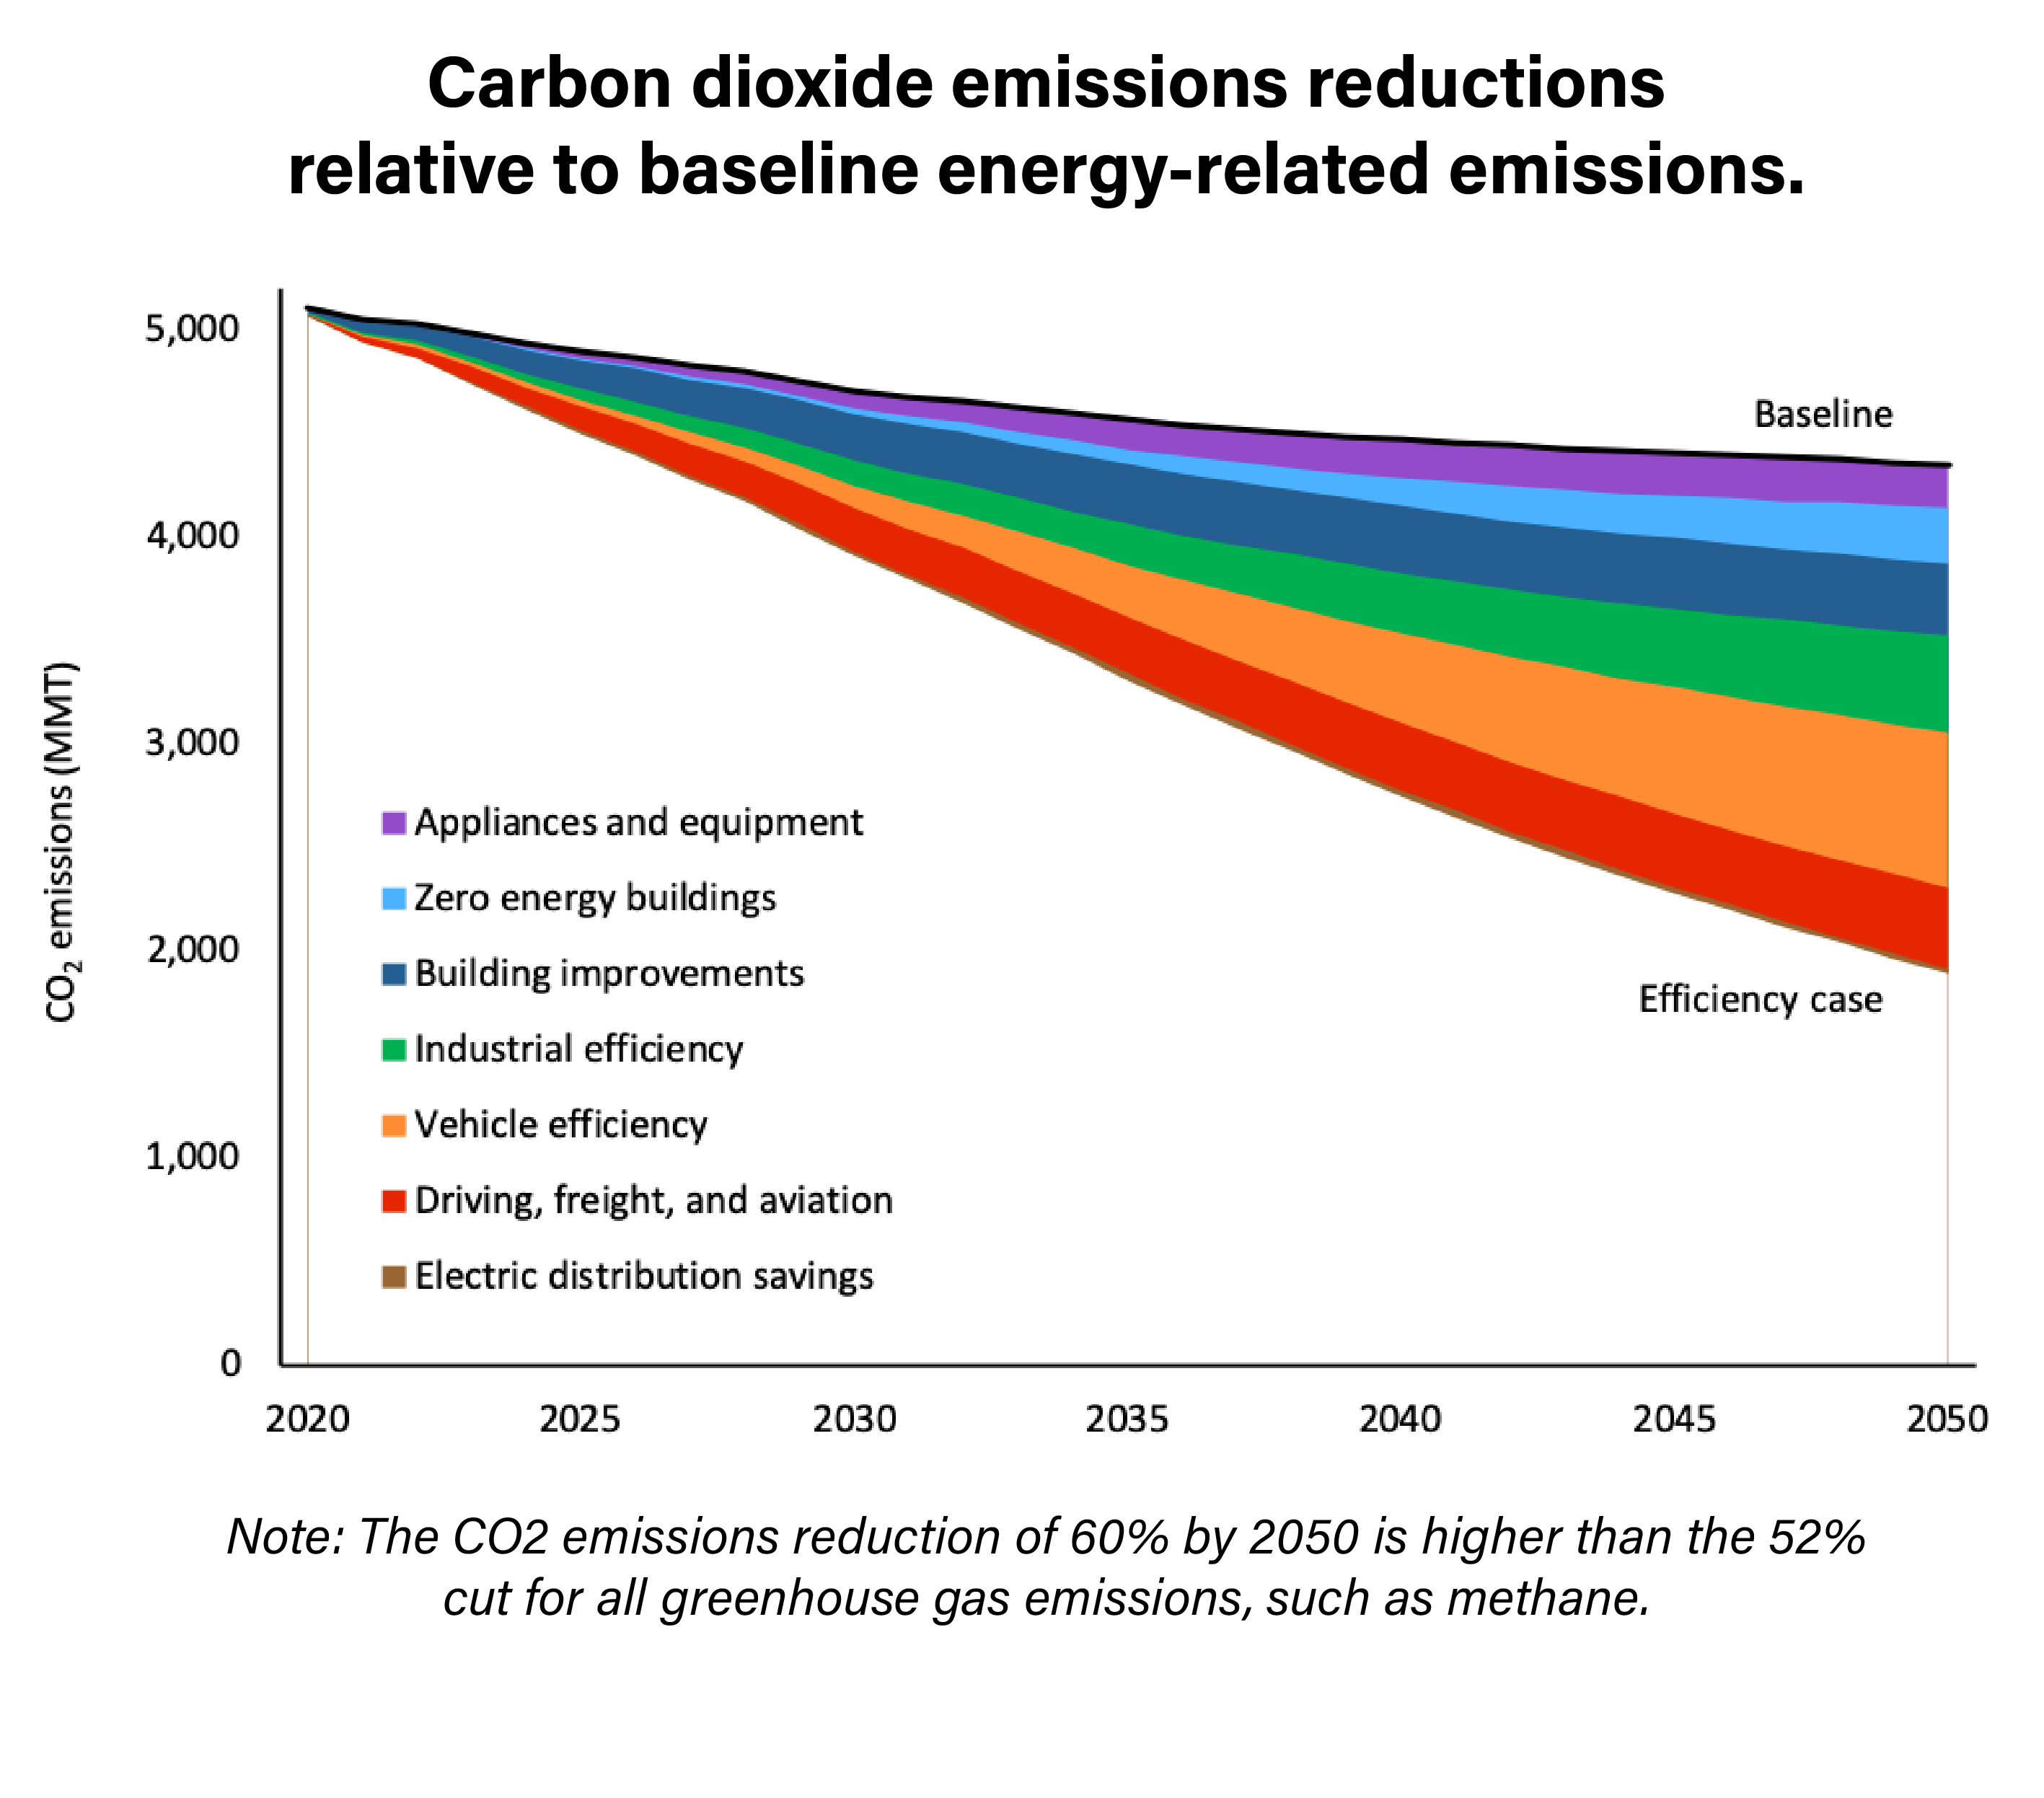 |
|
| 3.5.3.0 | details |
| 3.5.3.0 | details | | | | The major opportunities include: Transportation. A significant shift to electric cars and trucks and continued fuel economy gains under new standards could approximately halve vehicle carbon emissions. Also reducing emissions: less driving in cars and light trucks, improved freight system efficiency, and more-efficient airplanes. Buildings. New homes and commercial buildings could cut their emissions by 70% with efficient design and use of cleaner electricity. Existing homes and buildings slash emissions with energy-efficient upgrades, smart control technologies, and electrification of heating and cooling. Adding to total emissions cuts are updated efficiency standards for appliances and equipment and growth in the ENERGY STAR® program. Industry. The industrial sector could deliver hefty emissions cuts with strategic energy management, smart manufacturing, industrial process improvements (including electrification strategies), changes in feedstocks and new process technologies and materials. ?Energy efficiency is indispensable to climate change mitigation,? says Kathleen Gaffney, co-author of the IEA?s Energy Efficiency 2018 report. ?It?s already made an immense difference. Without efficiency measures implemented since 2000, global emissions in 2017 would have been 12% higher.? Vignesh Gowrishankar, co-author of a related 2017 NRDC report, says energy efficiency is among the least expensive and most effective ways to reduce much of our emissions. ?It also improves the cost and effectiveness of other critical solutions such as renewables, electric vehicles, and electric heat pumps,? he adds. ?The good news is that we can start right now by investing more in energy-efficient appliances, buildings, vehicles, and industrial plants,? says Lowell Ungar, ACEEE senior policy advisor and report co-author. ?But to achieve maximum emissions reductions, we need political and financial investments that go far beyond business as usual. If we do so, the 2050 payoff will be impressive.? The report says government policies and programs alone would deliver about $700 billion a year in energy savings by 2050. Plus, the authors note, such investment will create more jobs, boost grid resilience, reduce air pollution, and improve people?s health. The US government, however, is moving to weaken efficiency standards for light bulbs, appliances and equipment, cars, and trucks. At the same time, more US cities and states are boosting their efficiency and clean energy efforts, though they still have a long way to go. The report calls for scaling up energy efficiency measures, including: Rapid upgrades to vehicle standards, building energy codes, equipment efficiency standards, ENERGY STAR specifications, and state energy-savings targets. Substantial improvements to existing factories, homes, commercial buildings, and the electric grid and better management of energy use in all of them, spurred by government investment and requirements. More travel options and better management of freight and aviation energy use, including through user fees. A switch to electric vehicles, equipment, and industrial processes (along with a more efficient and cleaner power sector). Greater investment in research and development for new efficiency options in every sector, especially improved industrial processes. |
|
| 3.6.0.0 | Allocation of Energy Savings |
| 3.6.0.0 | Allocation of Energy Savings | | | | By Policy |
|
| 3.6.1.0 | Link |
| 3.6.1.0 | Link | | | | http://www.nacleanenergy.com/articles/35688/energy-efficiency-can-slash-emissions-and-get-us-halfway-to-climate-goals |
|
| 3.6.2.0 | images |
| 3.6.2.0 | images | | | | 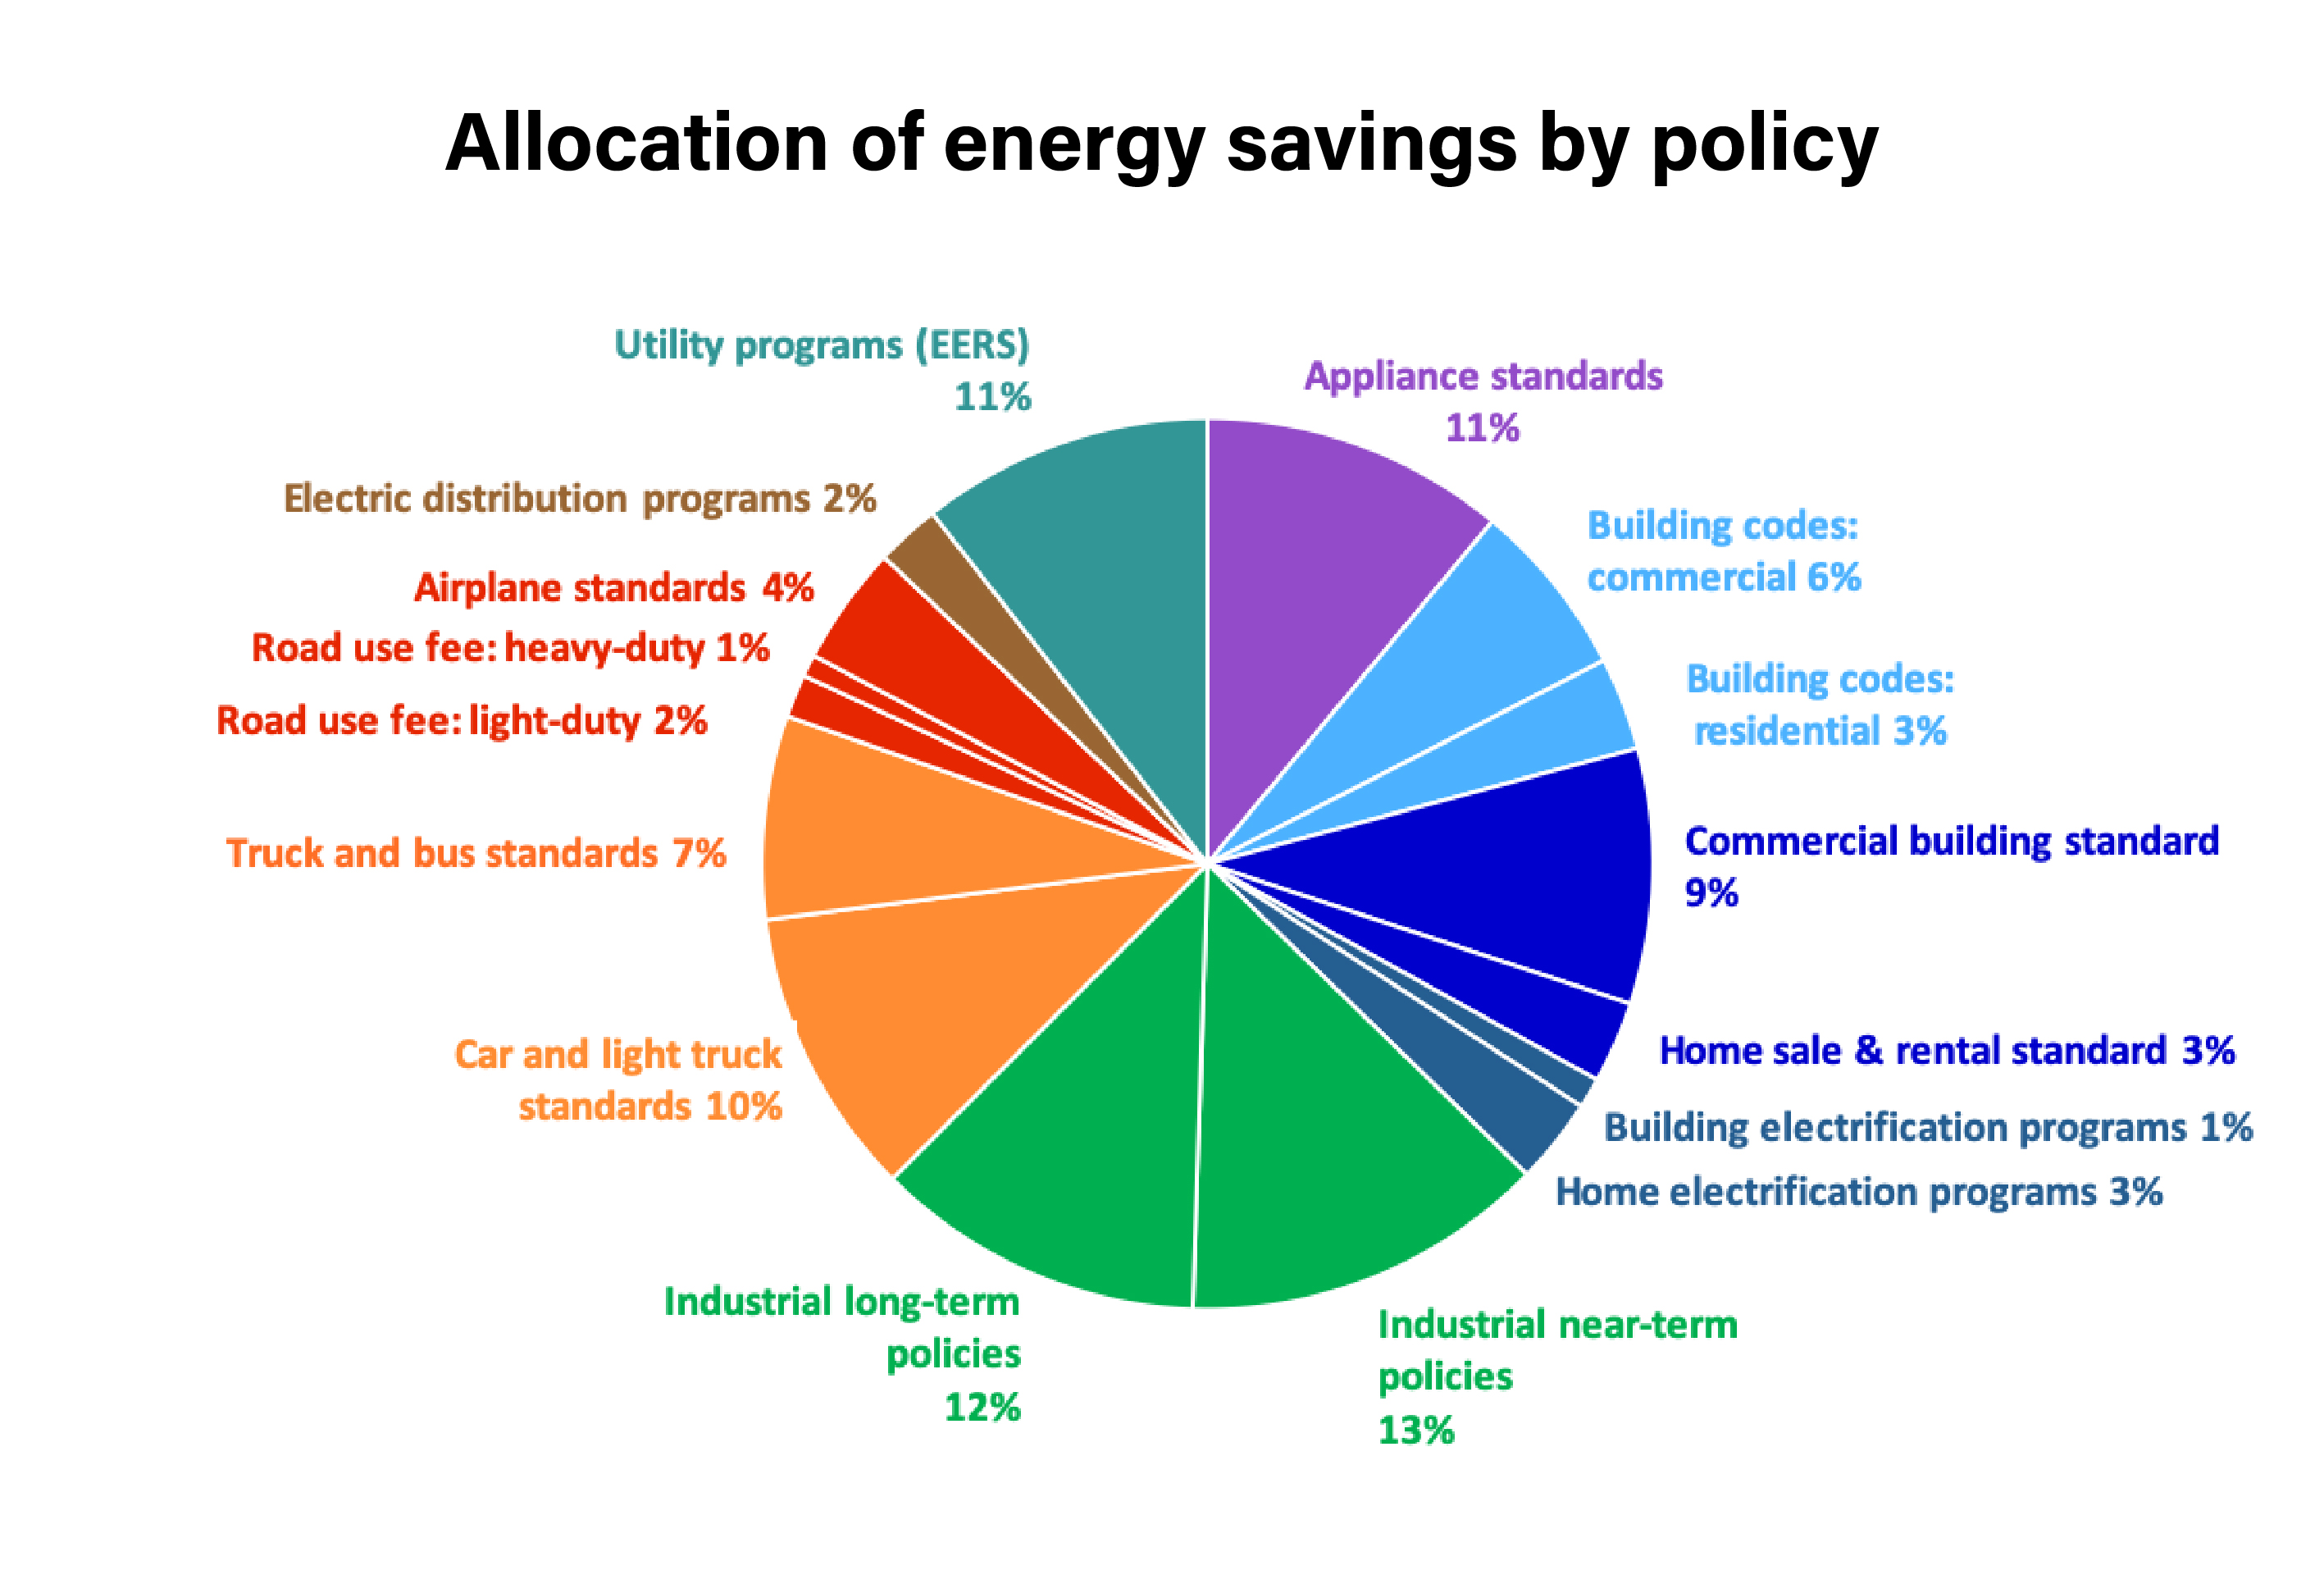 |
|
| 4.0.0.0 | Costs | | | | |
|
| 4.1.0.0 | Global Abatement Cost Curve (2013 - McKinsey) |
| 4.1.0.0 | Global Abatement Cost Curve (2013 - McKinsey) | | | | Potential mitigation options for greenhouse gas emissions |
|
| 4.1.1.0 | Link |
| 4.1.1.0 | Link | | | | https://ourworldindata.org/how-much-will-it-cost-to-mitigate-climate-change#note-6 |
|
| 4.1.2.0 | images |
| 4.1.2.0 | images | | | |  |
|
| 4.1.3.0 | details |
| 4.1.3.0 | details | | | | (This chart is a bit old but still provides examples of the potential for mitigation.) Our potential mitigation options are ordered from left-to-right in terms of cost (getting progressively more expensive as we move to the right). The higher the bar, the greater the cost. McKinsey?s analysis defines an upper cost threshold of ?60 per tonne avoided (i.e. the chart only shows alternatives that are ?cheaper? than ?60 per tonne). This is the level they consider to be most economically attractive to investors. This figure is somewhat arbitrary, and as we will see later, the report has also estimated potential emissions savings from technologies above ?60 per tonne separately. |
|
| 5.0.0.0 | Transportation | | | | |
|
| 5.1.0.0 | Fuel Consumption |
| 5.1.0.0 | Fuel Consumption | | | | Annual fuel used vs. MPG |
|
| 5.1.1.0 | images |
| 5.1.1.0 | images | | | |  |
|
| 5.1.2.0 | details |
| 5.1.2.0 | details | | | | Most of the time the discussion about fuel consumption does not focus on heavy-duty trucks. And that's where most of the fuel is consumed and CO2 generated. All-electric trucks are a ways off. Series hybrids, including those with in-wheel (hub) motors, are possible today with minor development. The hybrid configuration for trucks can be designed to be upgraded over time so fuel cells can replace the electric-generator component of the series hybrid. A number of other existing technology options exist for improving significantly mpg of heavier-duty truck chassis. |
|
| 6.0.0.0 | Resources | | | | |
|
| 6.1.0.0 | Designing Climate Solutions |
| 6.1.0.0 | Designing Climate Solutions | | | | Book |
|
| 6.1.1.0 | Link |
| 6.1.1.0 | Link | | | | https://islandpress.org/books/designing-climate-solutions |
|
| 6.1.2.0 | details |
| 6.1.2.0 | details | | | | With the effects of climate change already upon us, the need to cut global greenhouse gas emissions is nothing less than urgent. It?s a daunting challenge, but the technologies and strategies to meet it exist today. A small set of energy policies, designed and implemented well, can put us on the path to a low carbon future. Energy systems are large and complex, so energy policy must be focused and cost-effective. One-size-fits-all approaches simply won?t get the job done. Policymakers need a clear, comprehensive resource that outlines the energy policies that will have the biggest impact on our climate future, and describes how to design these policies well.
Designing Climate Solutions: A Policy Guide for Low-Carbon Energyis the first such guide, bringing together the latest research and analysis around low carbon energy solutions. Written by Hal Harvey, CEO of the policy firm Energy Innovation, with Robbie Orvis and Jeffrey Rissman of Energy Innovation, Designing Climate Solutions is an accessible resource on lowering carbon emissions for policymakers, activists, philanthropists, and others in the climate and energy community. In Part I, the authors deliver a roadmap for understanding which countries, sectors, and sources produce the greatest amount of greenhouse gas emissions, and give readers the tools to select and design efficient policies for each of these sectors. In Part II, they break down each type of policy, from renewable portfolio standards to carbon pricing, offering key design principles and case studies where each policy has been implemented successfully.
We don?t need to wait for new technologies or strategies to create a low carbon future?and we can?t afford to. Designing Climate Solutions gives professionals the tools they need to select, design, and implement the policies that can put us on the path to a livable climate future. |
|
| 6.2.0.0 | Project Drawdown |
| 6.2.0.0 | Project Drawdown | | | | Website and book |
|
| 6.2.1.0 | Link |
| 6.2.1.0 | Link | | | | https://drawdown.org/ |
|
| 6.2.2.0 | details |
| 6.2.2.0 | details | | | | Our mission is to help the world reach ?Drawdown?? the point in the future when levels of greenhouse gases in the atmosphere stop climbing and start to steadily decline, thereby stopping catastrophic climate change ? as quickly, safely, and equitably as possible. |
|
| 6.3.0.0 | U.S. Global Change Research Program (USGCRP) |
| 6.3.0.0 | U.S. Global Change Research Program (USGCRP) | | | | Website and books |
|
| 6.3.1.0 | Link |
| 6.3.1.0 | Link | | | | https://www.globalchange.gov/ |
|
| 6.3.2.0 | details |
| 6.3.2.0 | details | | | | The U.S. Global Change Research Program (USGCRP) is a Federal program mandated by Congress to coordinate Federal research and investments in understanding the forces shaping the global environment, both human and natural, and their impacts on society. USGCRP facilitates collaboration and cooperation across its 13 Federal member agencies to advance understanding of the changing Earth system and maximize efficiencies in Federal global change research. Together, USGCRP and its member agencies provide a gateway to authoritative science, tools, and resources to help people and organizations across the country manage risks and respond to changing environmental conditions. Fourth National Climate Assessment Vol I II The Fourth National Climate Assessment (NCA4), completed in November 2018, is a comprehensive and authoritative report on climate change and its impacts in the United States. NCA4 Vol II: Impacts, Risks, and Adaptation in the United States |
|
| 7.0.0.0 | Climate economics |
| 7.0.0.0 | Climate economics | | | | |
|
| 8.0.0.0 | Climate policy | | | | |
|
| 9.0.0.0 | Solar: passive, active |
| 9.0.0.0 | Solar: passive, active | | | | |
|
| 10.0.0.0 | Wind | | | | |
|
| 11.0.0.0 | Storage: battery: lithium, flow, redox, other |
| 11.0.0.0 | Storage: battery: lithium, flow, redox, other | | | | |
|
| 12.0.0.0 | Storage: hydro, molten salt, hydrogen, other |
| 12.0.0.0 | Storage: hydro, molten salt, hydrogen, other | | | | |
|