| 2 Meter Temparature - World (11/5/2024) 
|
2 Meter Temperature - Northern Hemisphere (11/5/2024) 
|
| 2 Meter Temperature - Southern Hemisphere (11/5/2024) 
|
2 Meter Temperature - Arctic (11/5/2024) 
|
| 2 Meter Temperature - Antarctic (11/5/2024) 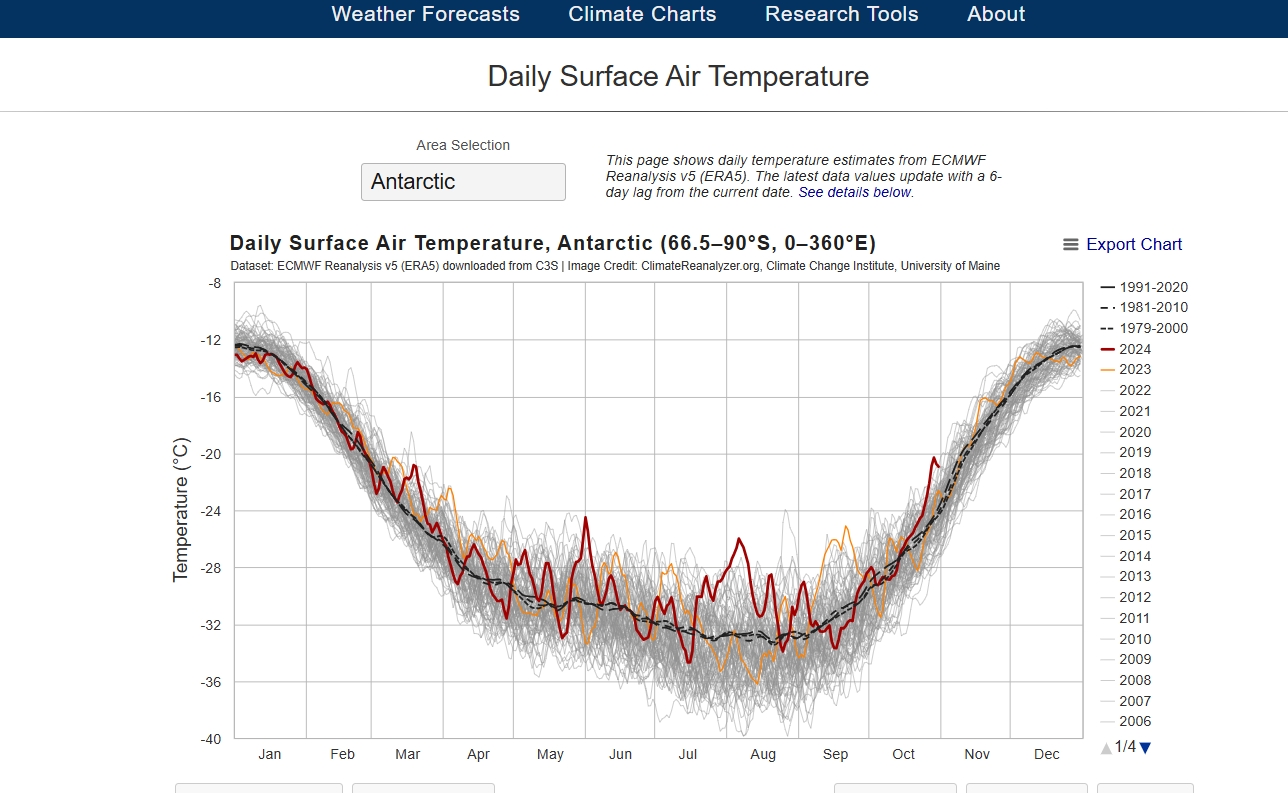
|
2 Meter Temperature - Tropics (11/5/2024) 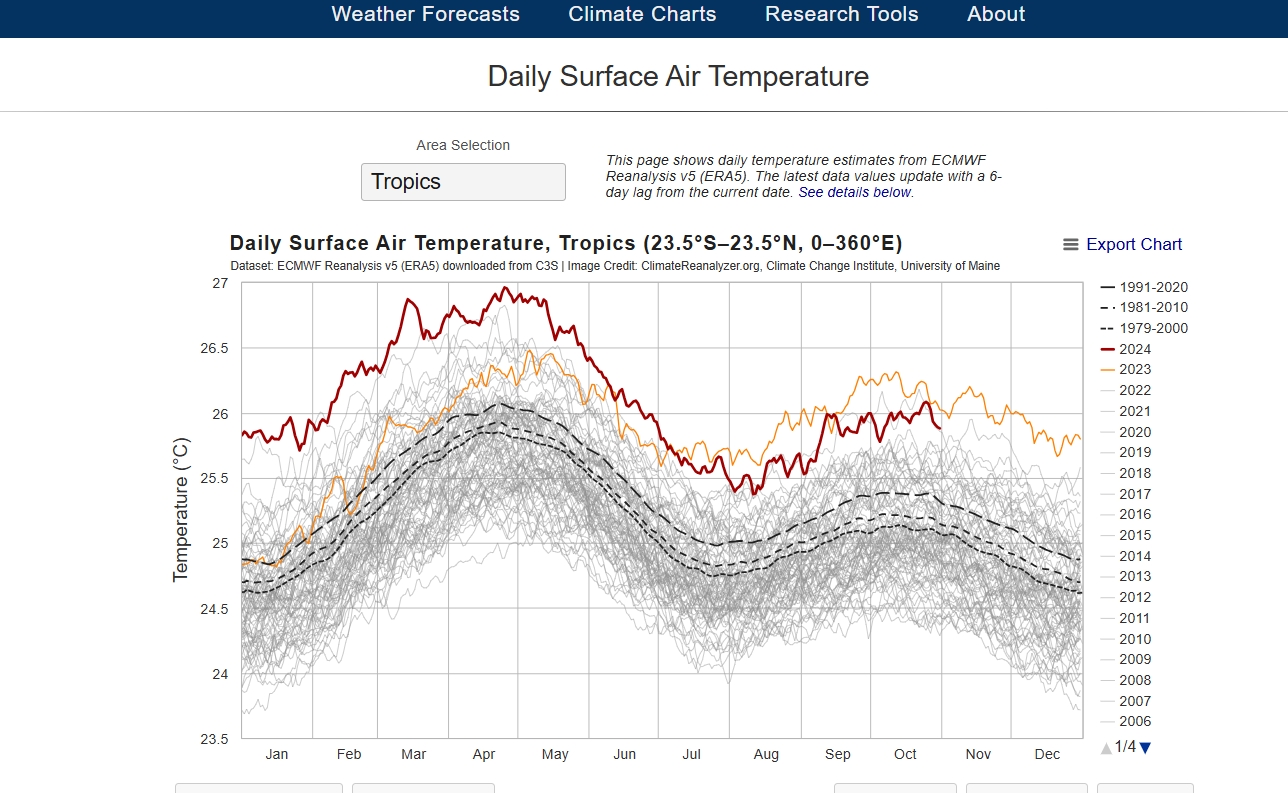
|
| Daily Sea Surface Temperature - World (60N-60S) (11/5/2024) 
|
Daily Sea Surface Temperature - North Atlantic (11/5/2024) 
|
| Daily Sea Ice Extent - Arctic (11/5/2024) 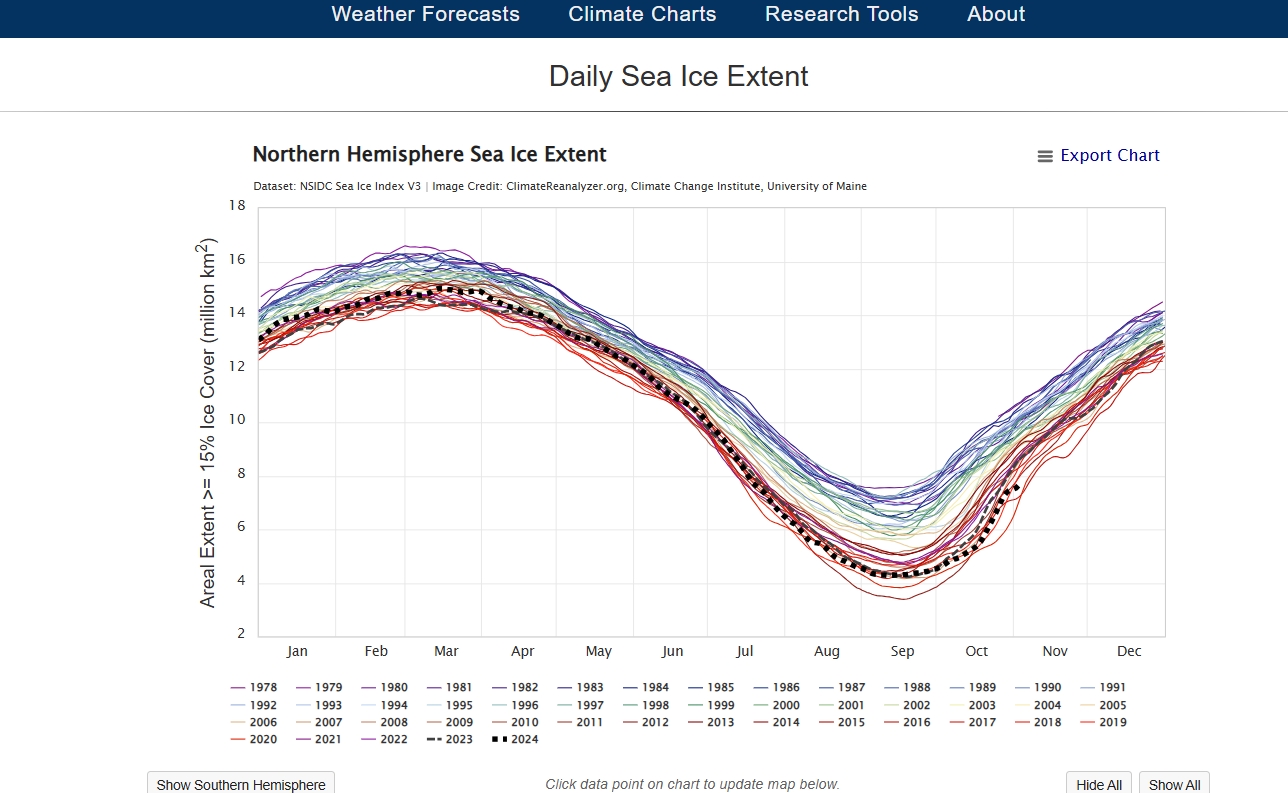
|
Daily Sea Ice Extent - Antarctic (11/5/2024) 
|
| Arctic Sea Ice Extent 
|
Arctic Sea Ice Extent 
|
| Greenland daily Melt Plot 
|
| Arctic Sea Ice Extent 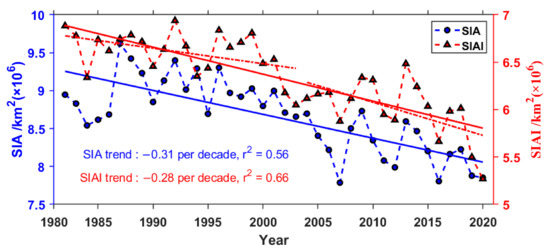
|
Monthly Arctic Sea Ice Volume for April and Sep 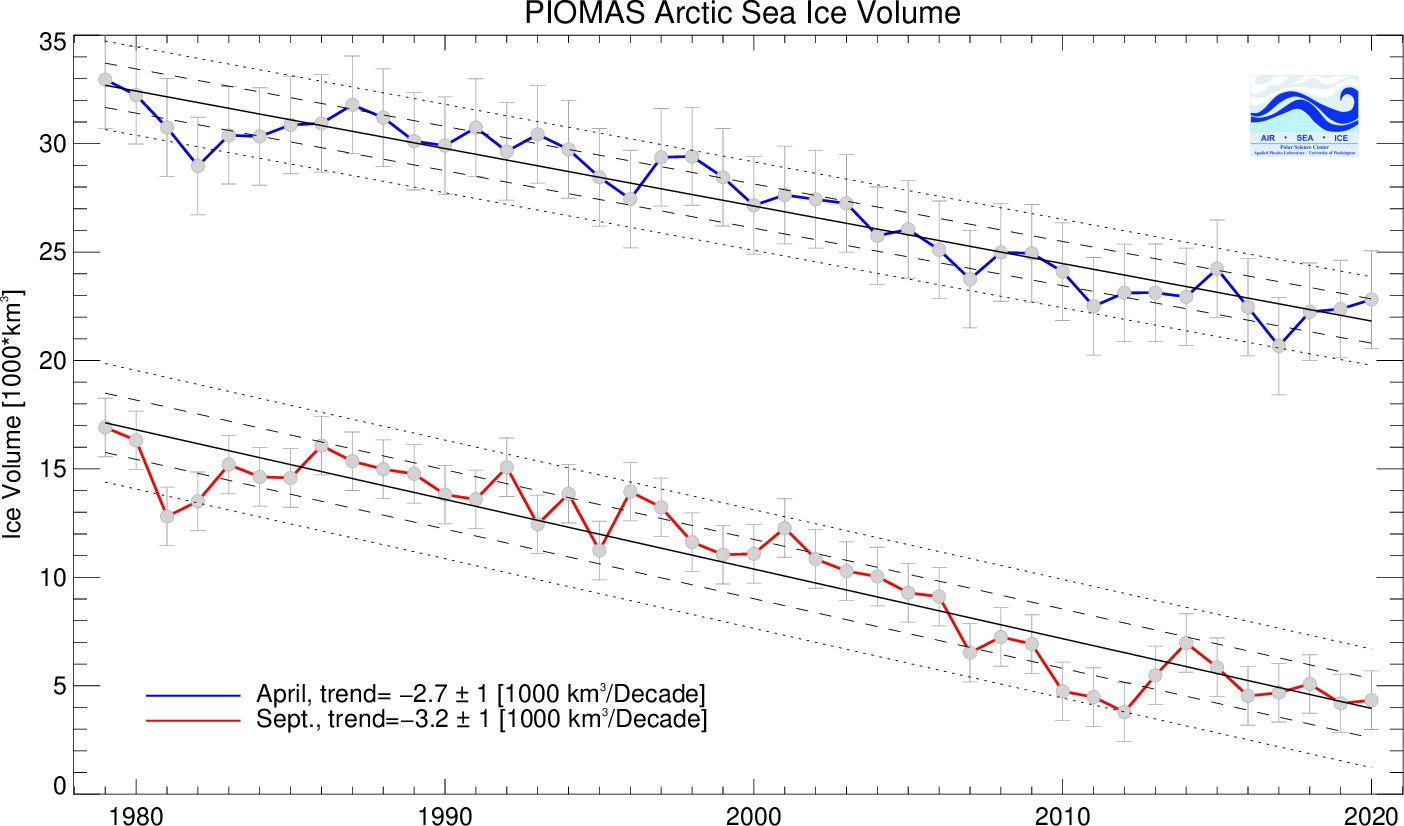
|
Average Arctic sea ice thickness for a selection of years. 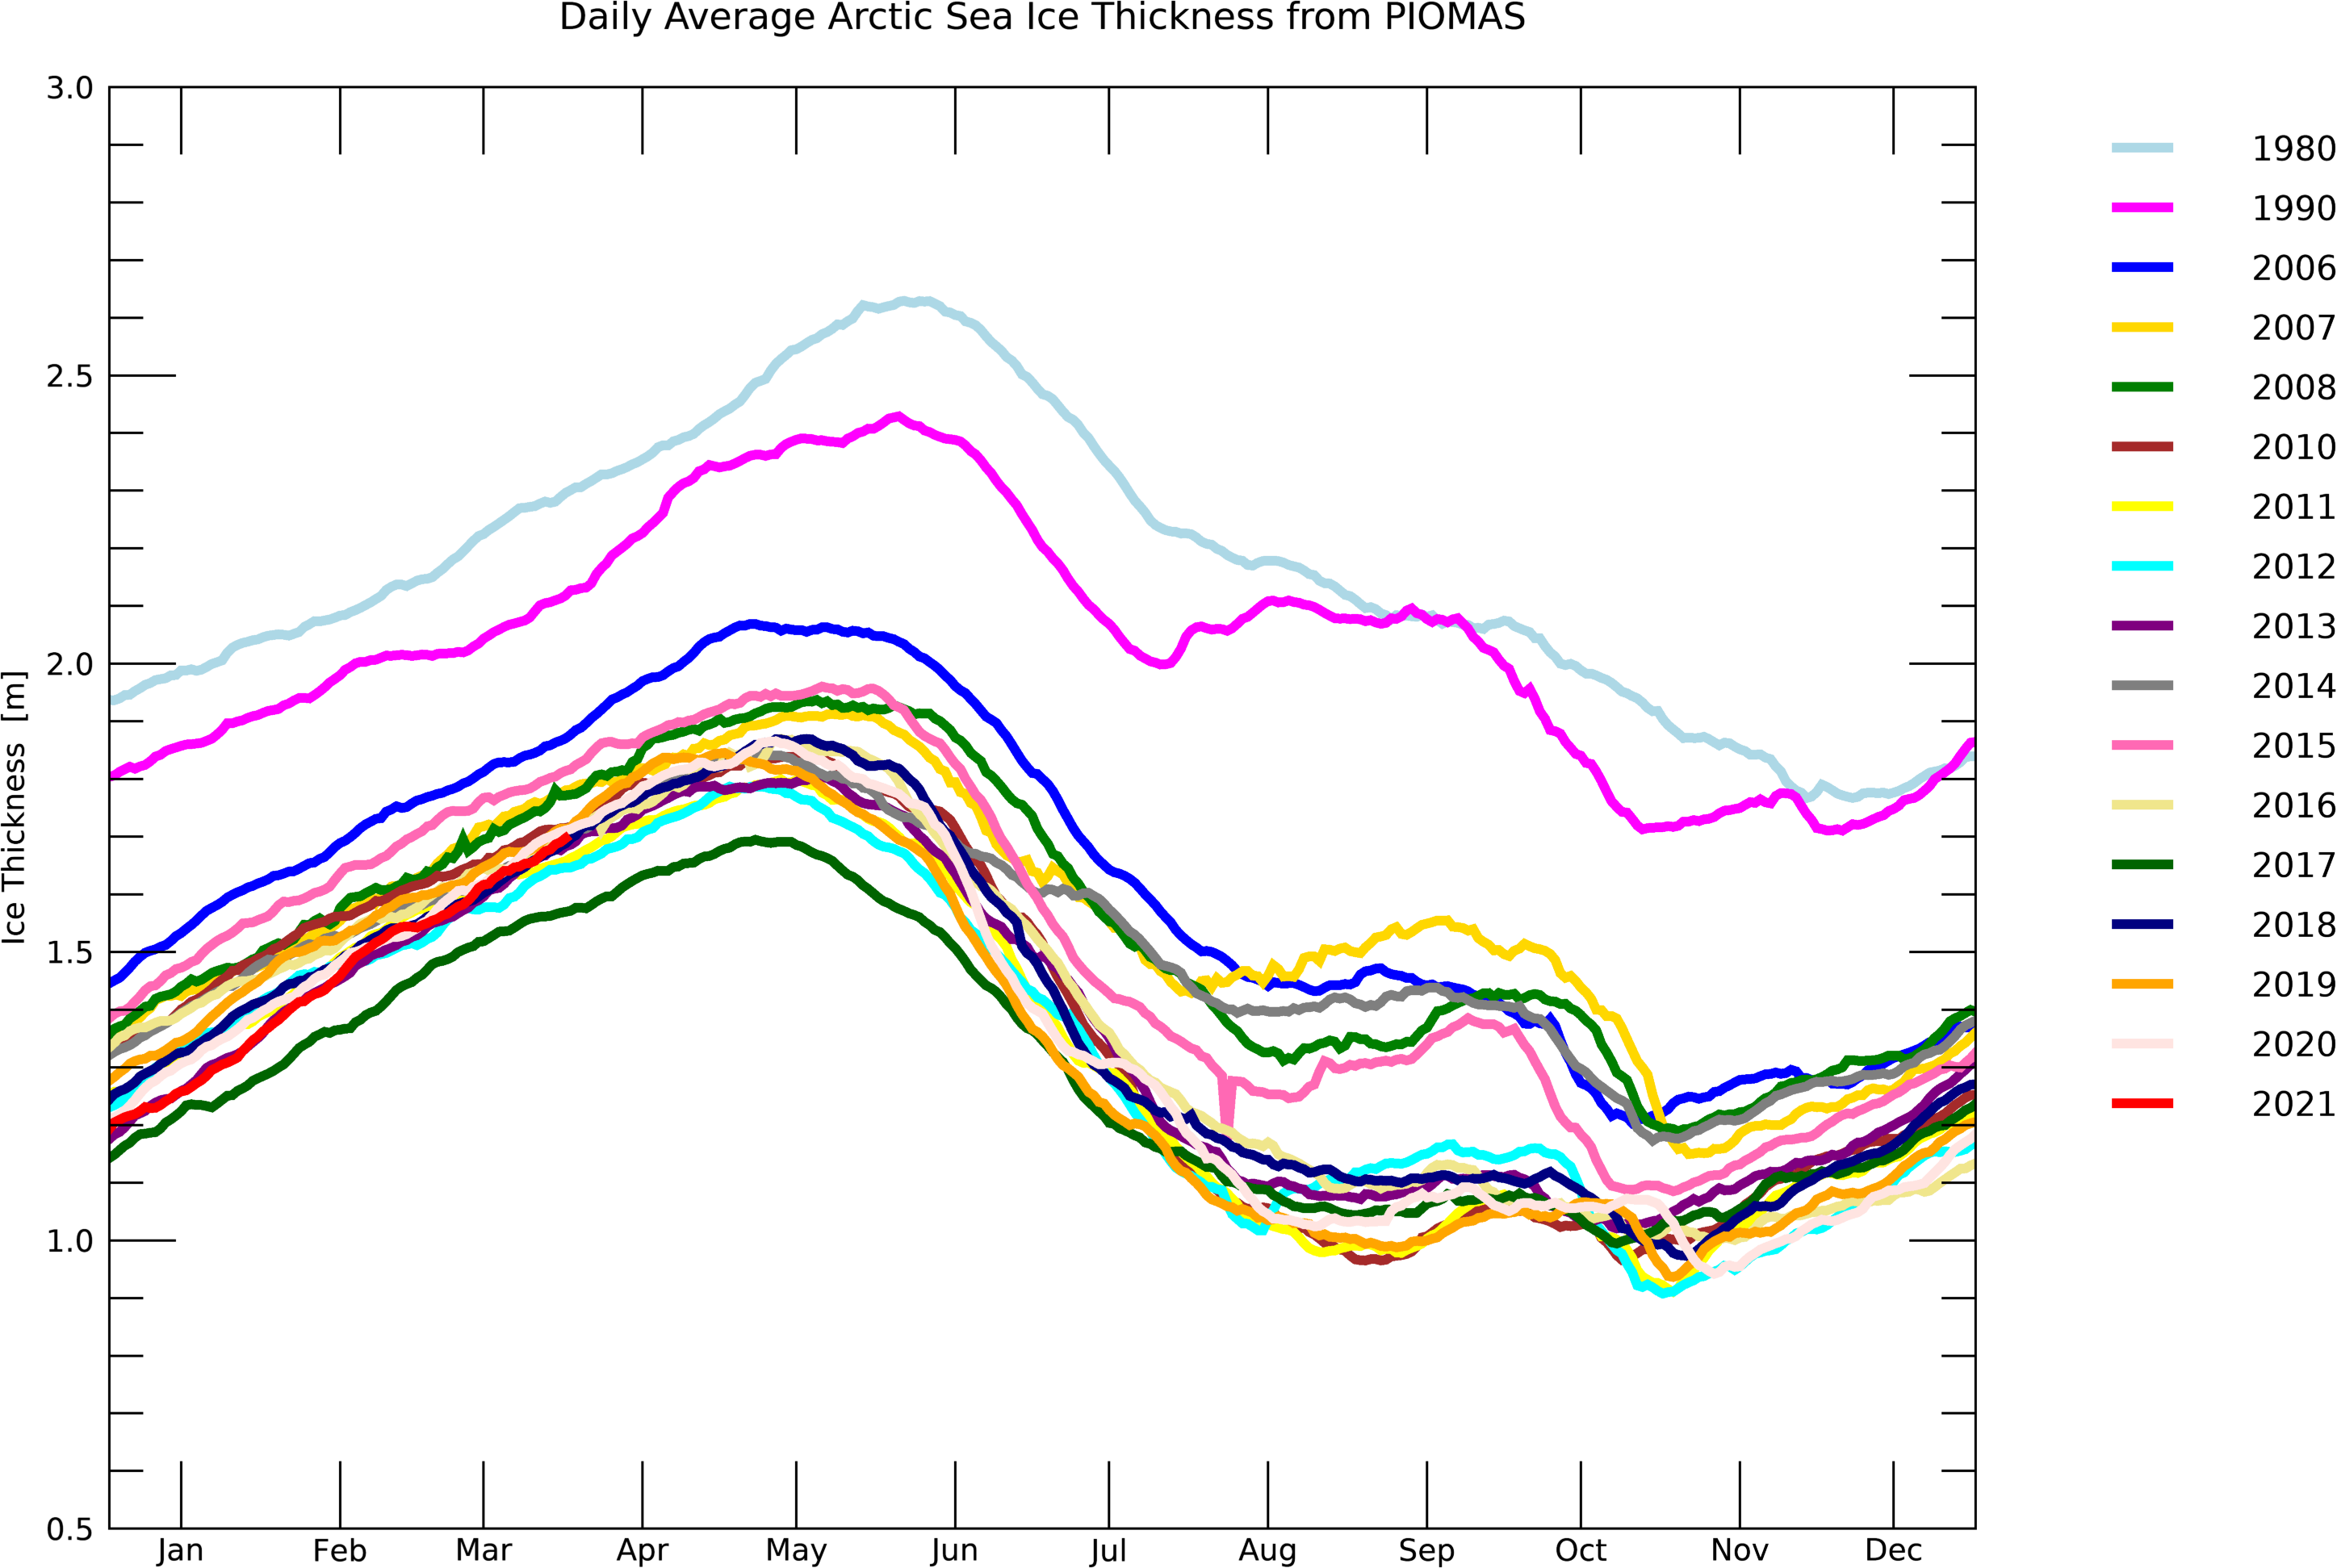
|
Northern Hemisphere Snow Cover Extent - May Anomolies (1966-2020) 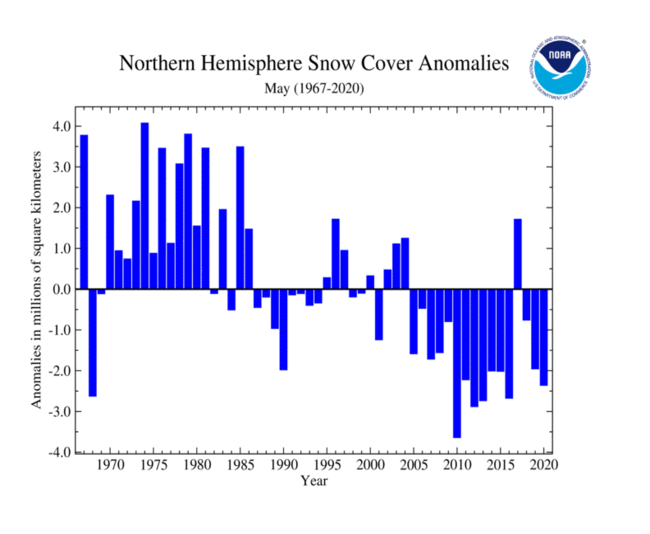
|
Annual mass balance change of reference glaciers 1950-2020 (excl. Antarctica and Greenland) 
|
| Greenland (left) and Antartica (right) Ice Sheet Mass Loss (2002-2020) 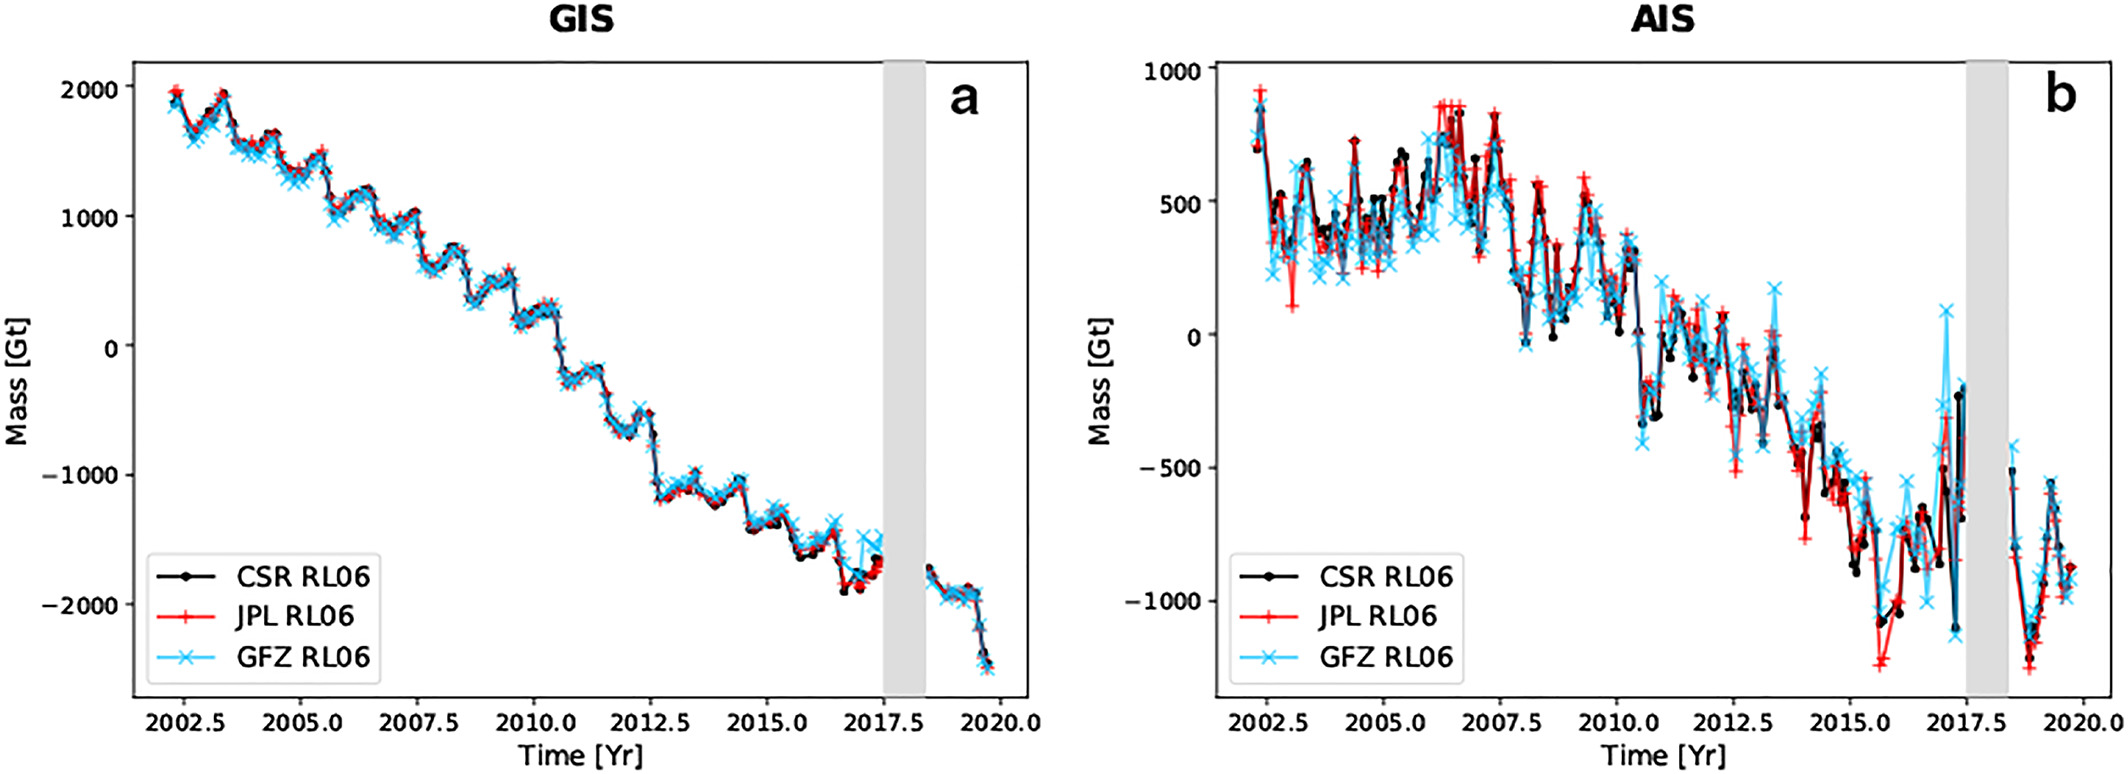
|
| Mauna Loa CO2 - Last Two Years 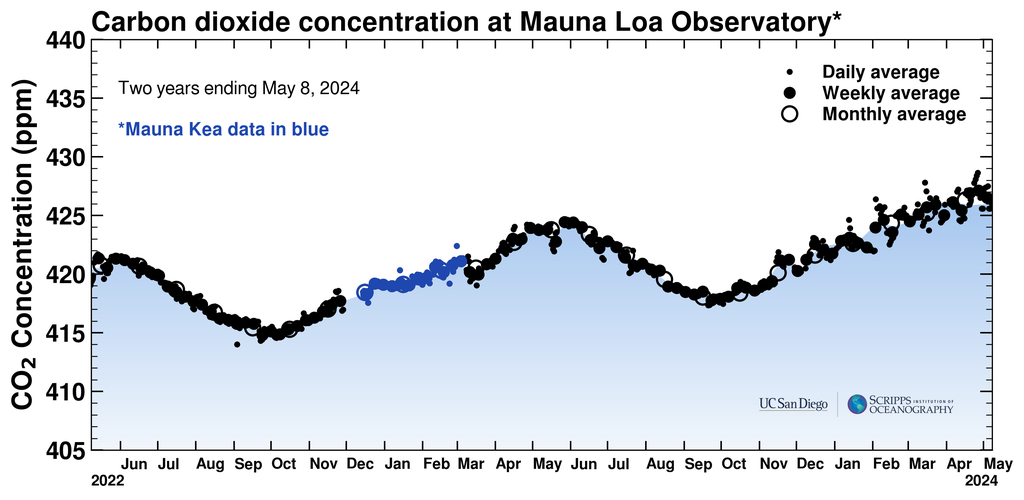
|
Annual mean carbon dioxide growth rates for Mauna Loa 
|
| Recent Global CH4 Monthly Means 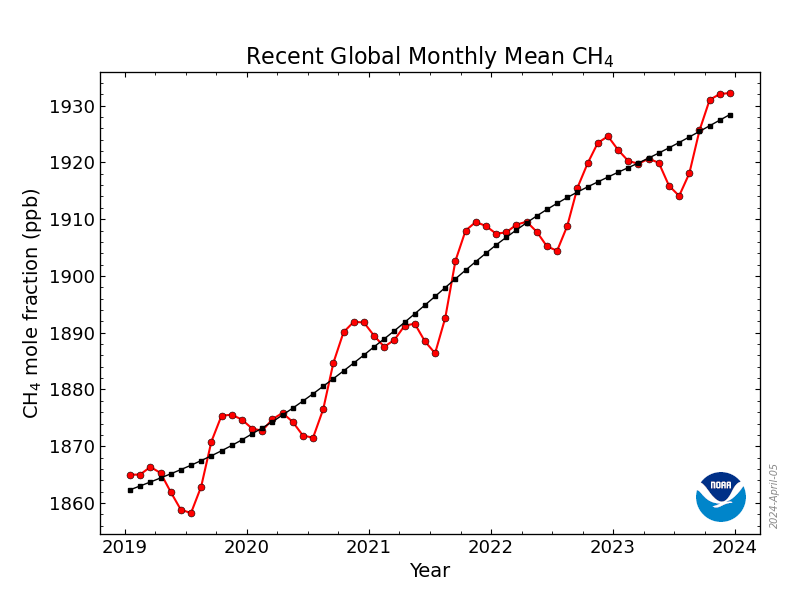
|
Global CH4 Monthly Means 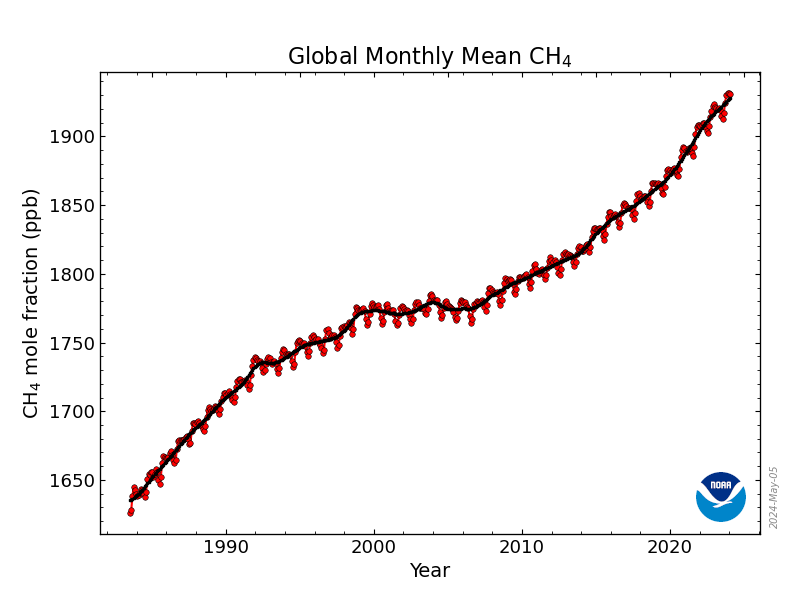
|
| Annual greenhouse gas index (AGGI) 
|
Annual Sea Level Rise (1990-20200 
|
| Comparison of temperature of several years in recent past 
|
| Global Average Temperature 
|
| Surface Temparature Relative to 1950-1981 Mean 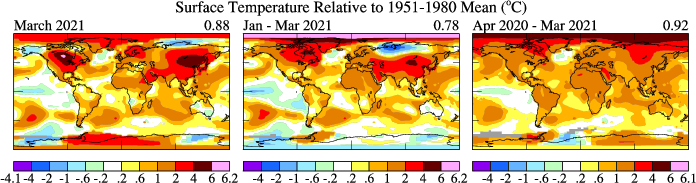
|
| Global Ocean Heat Content 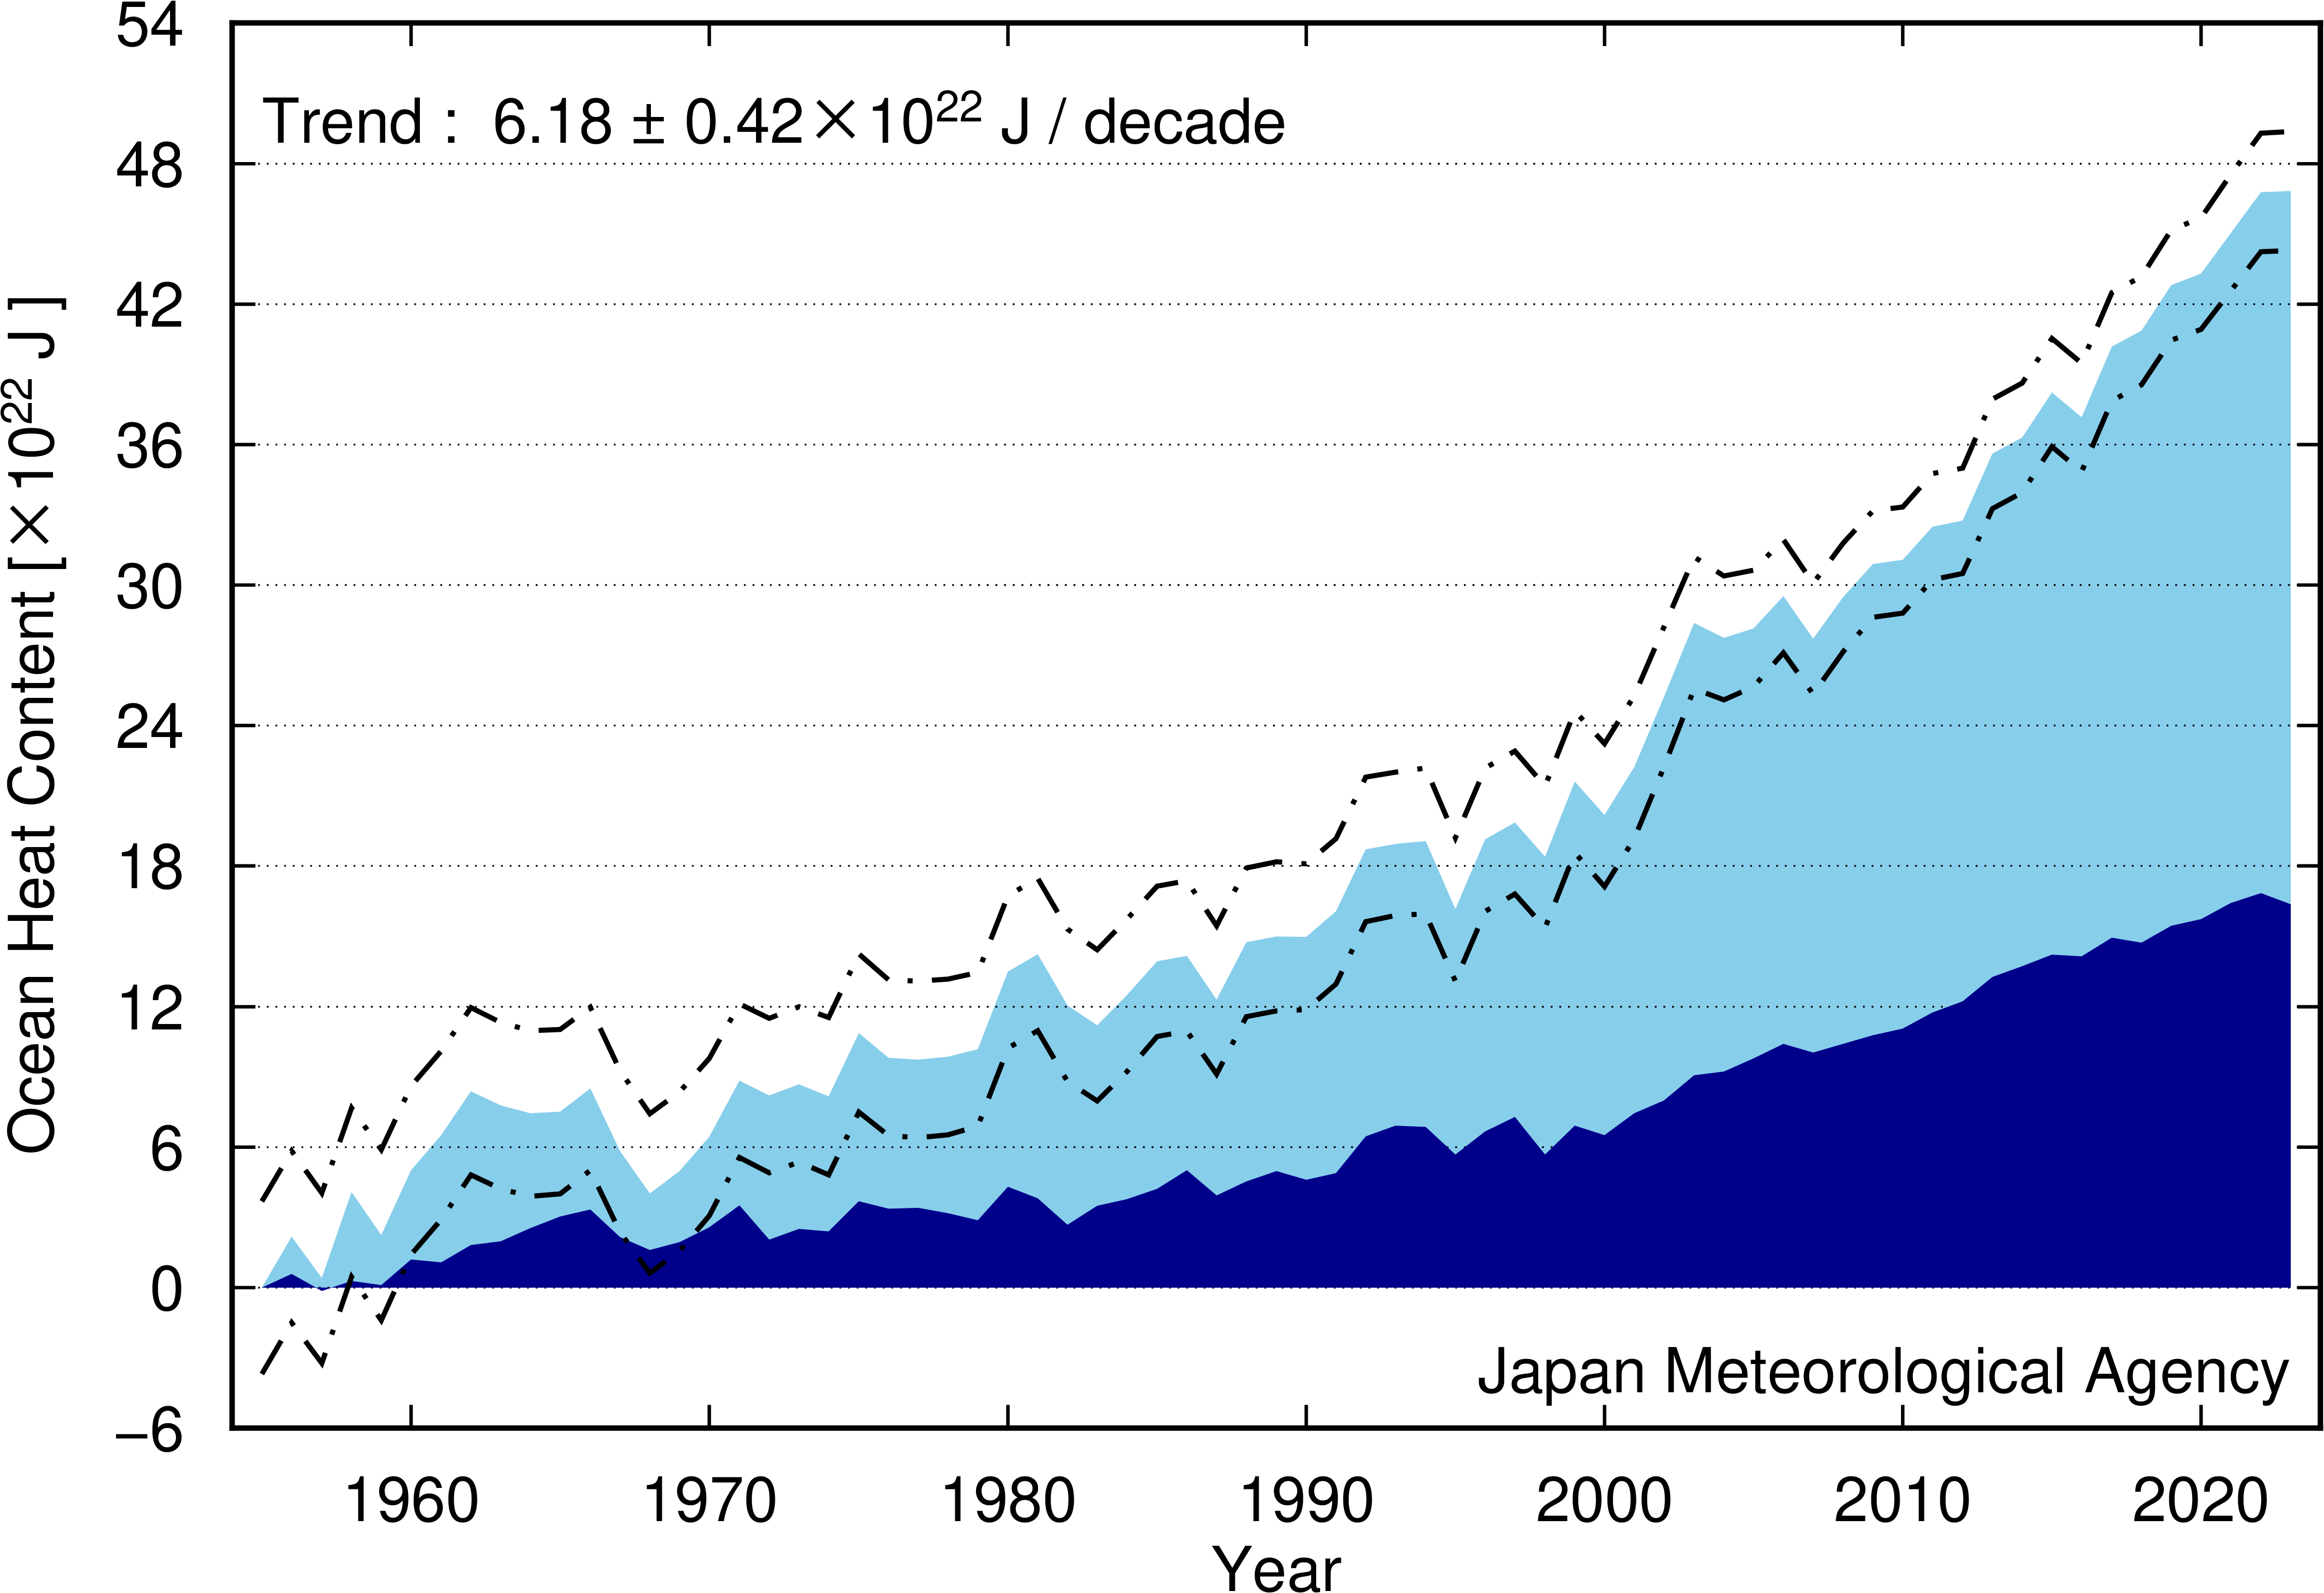
|
Change In Ocean Heat Content 1993-2019 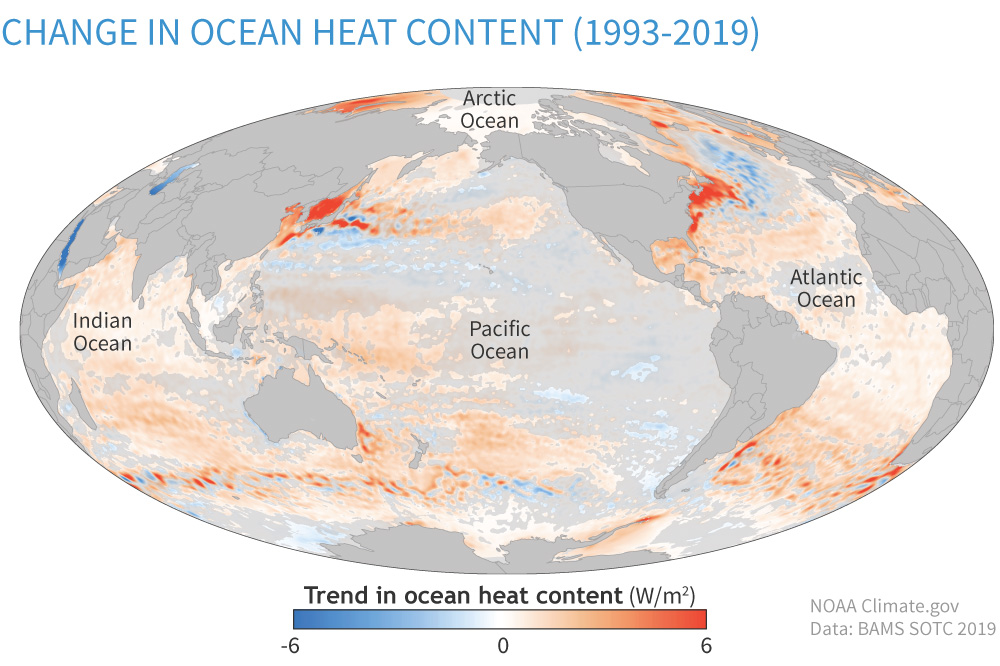
|
| US Drought Monitor 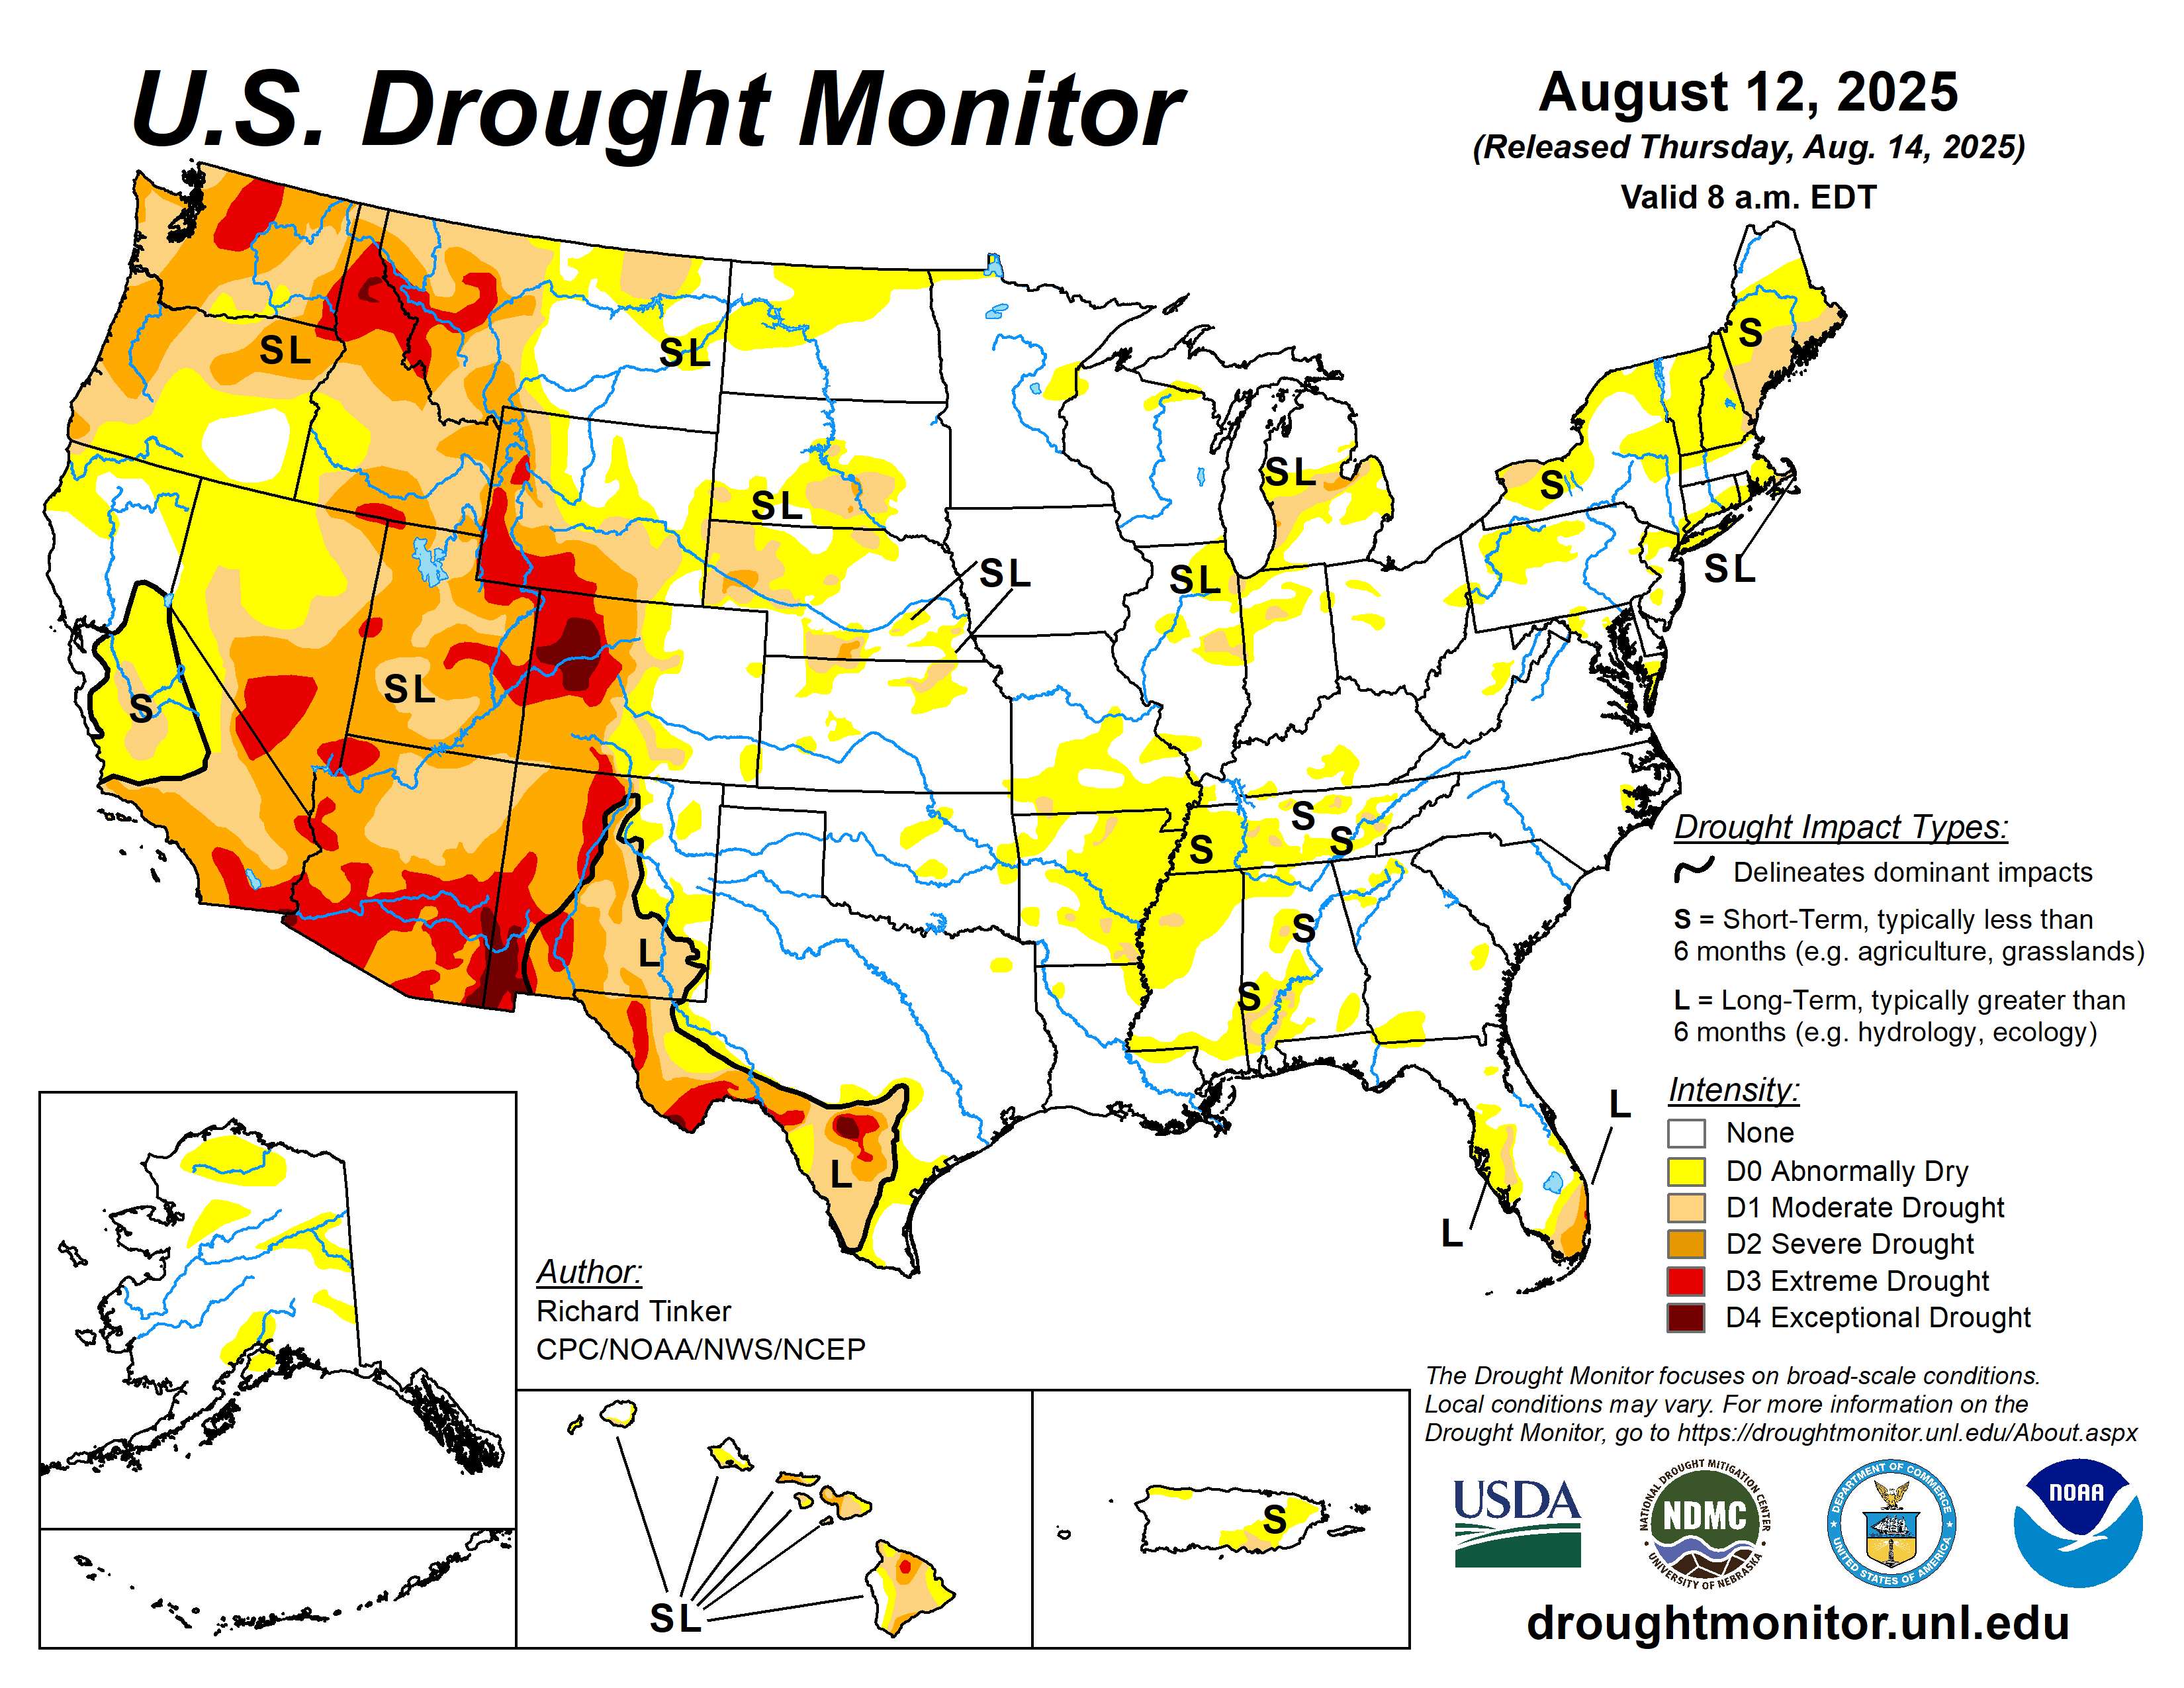
|
Atlantic Tropical Cyclones and Disturbances . 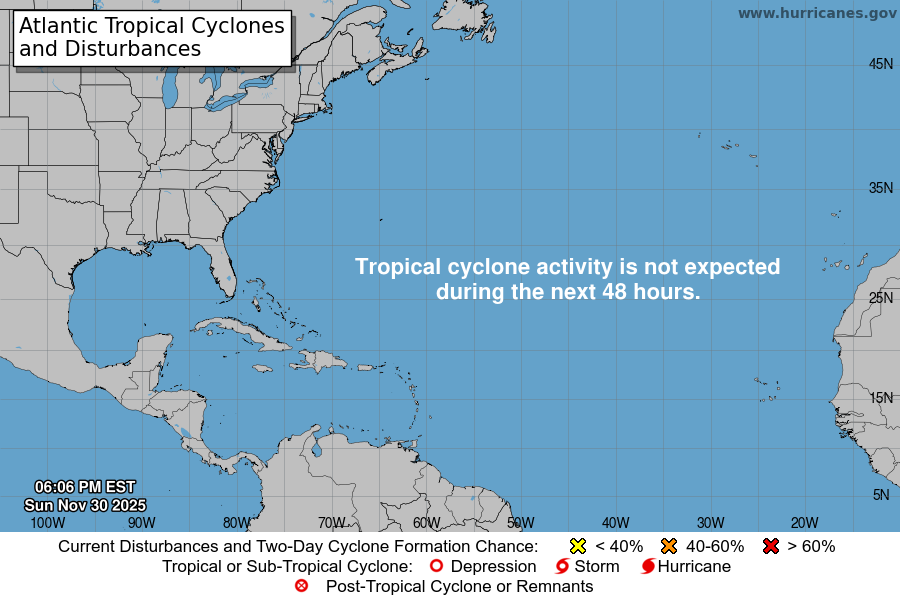
|