Oceans
This Fact Page displays text and images related to global warming and climate change
(Hover your mouse over the text below to "popup" a window with a related text.
Click on the text or image to open a new window with a detailed description.)
|
|
| Energy absorbed by the Earth 1970-2010 - Most of the heat is going into the oceans | | As a result of the increase in atmospheric CO2, the Earth has been absorbing an excess of about 8 zeta joules of energy/year (the equivalent of a 50 megaton nuclear bomb being exploded every 15 minutes), with almost all of the energy going in to warming the oceans. | 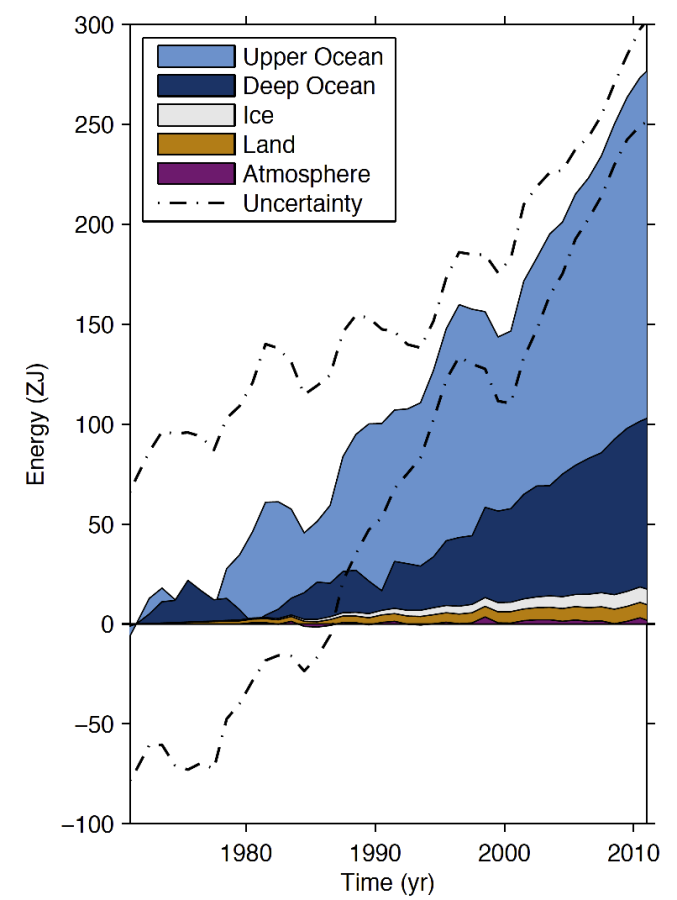
(Box 3.1 Fig 1) Plot of energy accumulation in zettajoules within distinct components of Earth’s climate system relative to 1971 and from 1971–2010 unless otherwise indicated. Ocean warming (heat content change) dominates, with the upper ocean (light blue, above 700 m) contributing more than the deep ocean (dark blue, below 700 m; including below 2000 m estimates starting from 1992). Ice melt (light grey; for glaciers and ice caps, Greenland and Antarctic ice sheet estimates starting from 1992, and Arctic sea ice estimate from 1979–2008); continental (land) warming (orange); and atmospheric warming (purple; estimate starting from 1979) make smaller contributions. Uncertainty in the ocean estimate also dominates the total uncertainty (dot-dashed lines about the error from all five components at 90% confidence intervals). | The oceans have a huge thermal mass compared to the atmosphere and land surface. They act as the planet’s heat storage and transportation system, as the ocean currents redistribute the heat. This is important because if we look at the global surface temperature as an indication of warming, we’re only getting some of the picture. The oceans act as a huge storage heater, and will continue to warm up the lower atmosphere (no matter what changes we make to the atmosphere in the future). | | | Source: johncarlosbaez | URL: http://johncarlosbaez.wordpress.com/2014/04/11/what-does-the-new-ipcc-report-say-about-climate-change-part-4/
(The text for the image(s) on this Web page was taken from the above source.) |
| Climate Change Trends (as of 2019 or 2020) | | Global Ocean Heat Content 1979-2020 (relative to 1981-2010) | 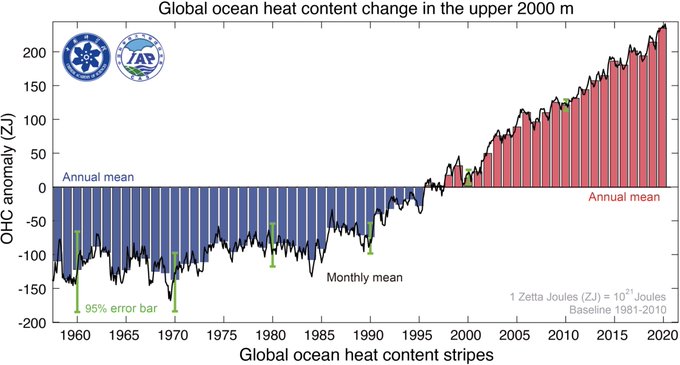
1979: near -100 Zettajoules; 2020: near +250 Zettajoules (+350 ZJ)
Sea Level Rise 1979-2020 (relative to 1880) | | | URL: https://www.patreon.com/posts/climate-change-46574708 |
| Upper Ocean Temperatures Hit Record High in 2020 | | Global upper 2000 m ocean heat content from 1958 through 2020 | 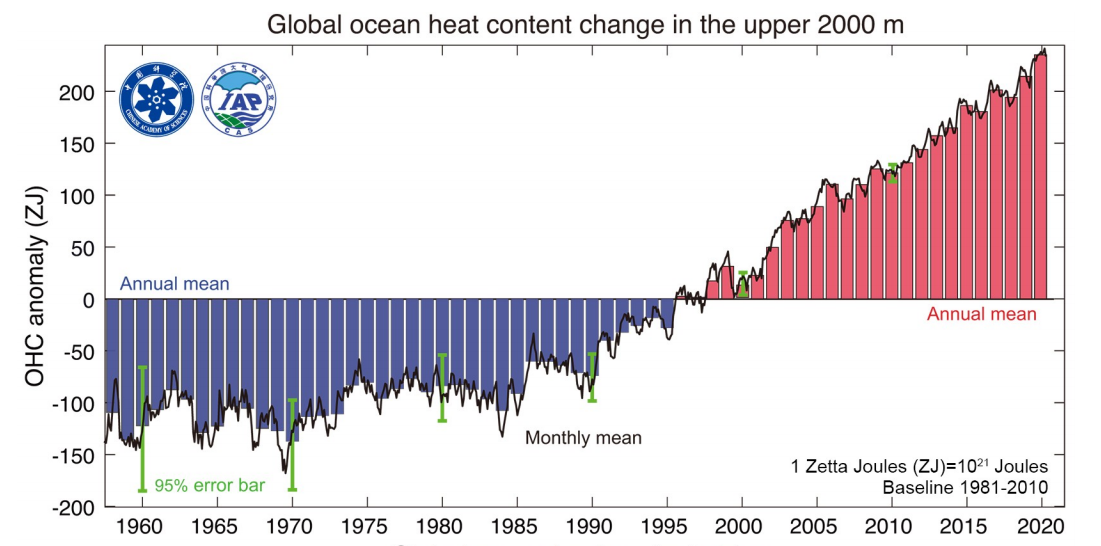
Fig. 1. (Upper) Global upper 2000 m OHC from 1958 through 2020. The histogram presents annual anomalies relative to a 1981-2010 baseline, with positive anomalies shown as red bars and negative anomalies as blue. | | | URL: https://link.springer.com/article/10.1007/s00376-021-0447-x |
| Upper Ocean Temperatures Hit Record High in 2020 | | Ocean heat budget from 1960 to 2020 | 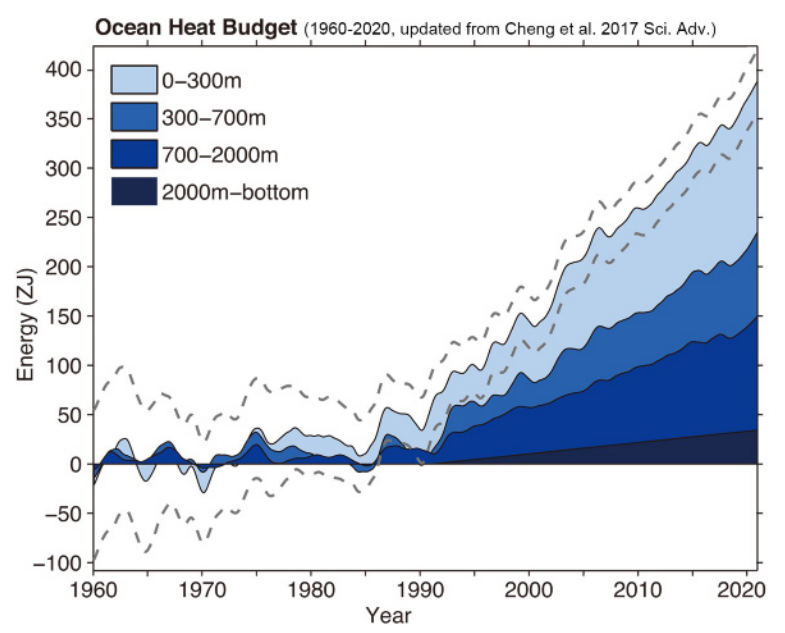
Fig. 2. Ocean heat budget from 1960 to 2020 based on IAP analysis data from 0 to 2000 m, and from Purkey and Johnson (2010) for deep ocean change below 2000 m (units: ZJ). Figure updated from Cheng et al. (2017). The anomalies are relative to 1958-62 baseline, and the time series are smoothed by LOWESS (locally weighted scatterplot smoothing) with span width of 24 months. The gray dashed lines are the 95% confidence interval of the total ocean heat budget. | | | URL: https://link.springer.com/article/10.1007/s00376-021-0447-x |
| Upper Ocean Temperatures Hit Record High in 2020 | | Regional observed upper 2000 m ocean heat content change from 1955 through 2020 | 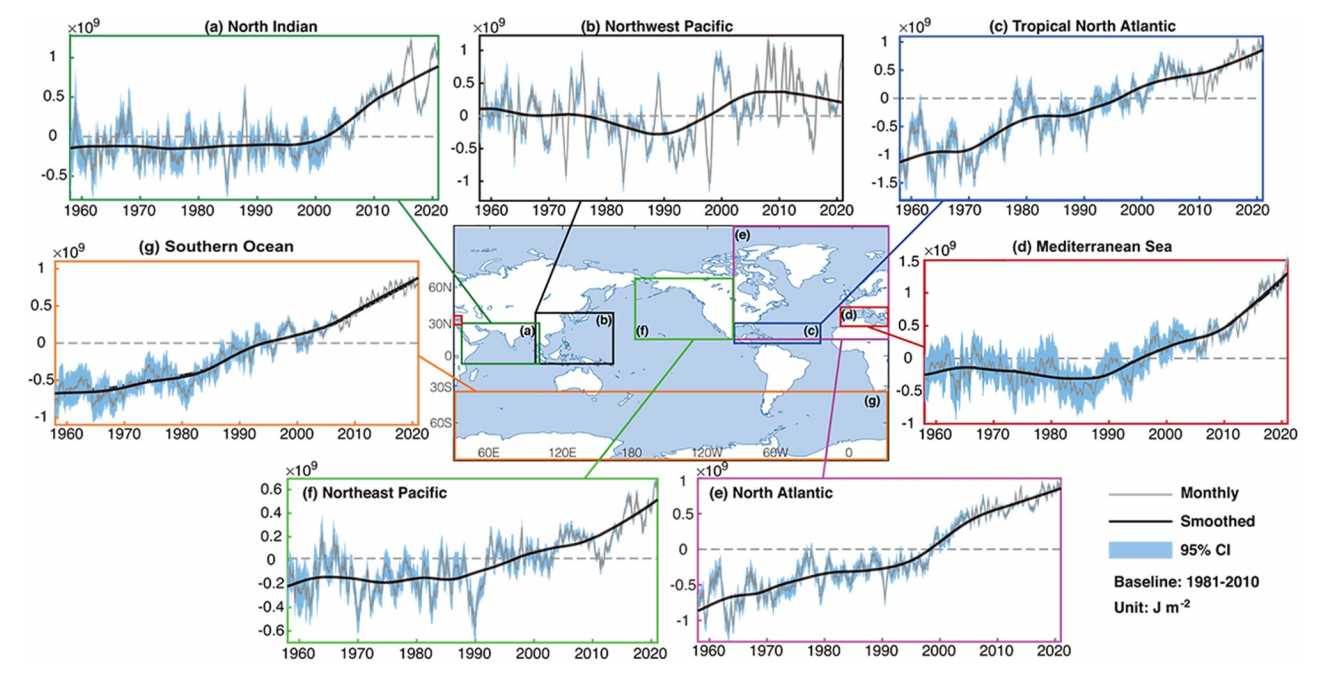
Fig. 4. Regional observed upper 2000 m OHC change from 1955 through 2020 relative to 1981-2010 baseline. The time series (black) are smoothed by LOWESS (locally weighted scatterplot smoothing) with span width of 24 months. The blue shadings are the 95% confidence interval. [Data updated from Cheng et al. (2017)]. | | | URL: https://link.springer.com/article/10.1007/s00376-021-0447-x |
| Sea Surface Temperature - 1880-2012 | 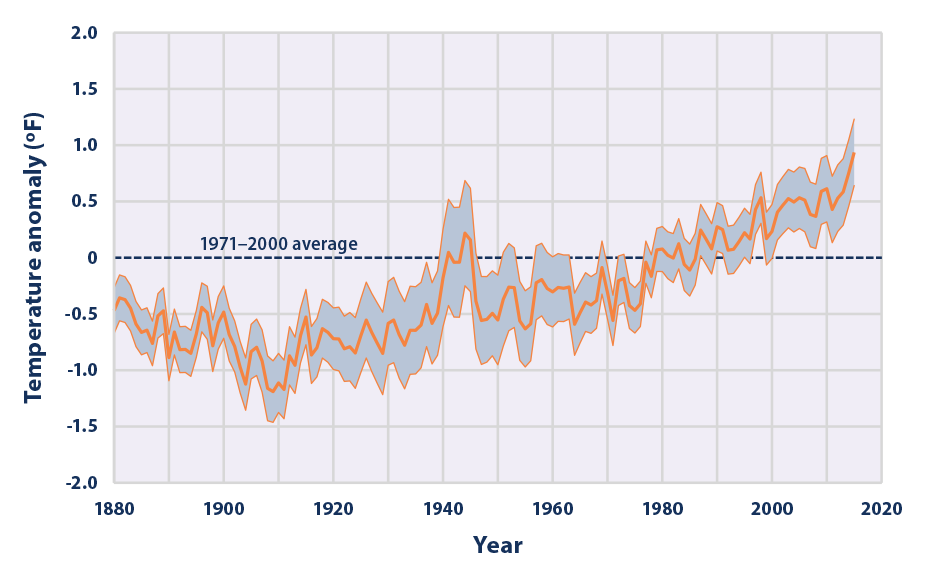
This graph shows how the average surface temperature of the world's oceans has changed since 1880. This graph uses the 1971 to 2000 average as a baseline for depicting change. Choosing a different baseline period would not change the shape of the data over time. The shaded band shows the range of uncertainty in the data, based on the number of measurements collected and the precision of the methods used. | The average surface temperature of the world's oceans has been increasing since about 1910. | | | Source: EPA | | URL: https://www.epa.gov/climate-indicators/climate-change-indicators-sea-surface-temperature |
| IPCC 1.5° C Report | | Table 2.2 | The assessed remaining carbon budget and its uncertainties. | 
Shaded blue horizontal bands illustrate the uncertainty in historical temperature increase from the 1850–1900 base period until the 2006–2015 period as estimated from global near-surface air temperatures, which impacts the additional arming until a specific temperature limit like 1.5°C or 2°C relative to the 1850–1900 period. Shaded grey cells indicate values for when historical temperature increase is estimated from a blend of near-surface air temperatures over land and sea ice regions and sea-surface temperatures over oceans.
Notes: *(1) Chapter 1 has assessed historical warming between the 1850–1900 and 2006–2015 periods to be 0.87°C with a ±0.12°C likely (1-standard deviation) range, and global near-surface air temperature to be 0.97°C. The temperature changes from the 2006–2015 period are expressed in changes of global near-surface air temperature. *(2) Historical CO2 emissions since the middle of the 1850–1900 historical base period (mid-1875) are estimated at 1940 GtCO2 (1640–2240 GtCO2, one standard deviation range) until end 2010. Since 1 January 2011, an additional 290 GtCO2 (270–310 GtCO2 , one sigma range) has been emitted until the end of 2017 (Le Quéré et al., 2018). *(3) TCRE: transient climate response to cumulative emissions of carbon, assessed by AR5 to fall likely between 0.8–2.5°C/1000 PgC (Collins et al., 2013), considering a normal distribution consistent with AR5 (Stocker et al., 2013). Values are rounded to the nearest 10 GtCO2 . *(4) Focussing on the impact of various key uncertainties on median budgets for 0.53°C of additional warming. *(5) Earth system feedbacks include CO2 released by permafrost thawing or methane released by wetlands, see main text. *(6) Variations due to different scenario assumptions related to the future evolution of non-CO2 emissions. *(7) The distribution of TCRE is not precisely defined. Here the influence of assuming a lognormal instead of a normal distribution shown. *(8) Historical emissions uncertainty reflects the uncertainty in historical emissions since 1 January 2011. | | | URL: https://www.ipcc.ch/site/assets/uploads/sites/2/2019/05/SR15_Chapter2_Low_Res.pdf |
| Total Heat Content (Oceans, Atmosphere, and Land) - 1960-2008 | 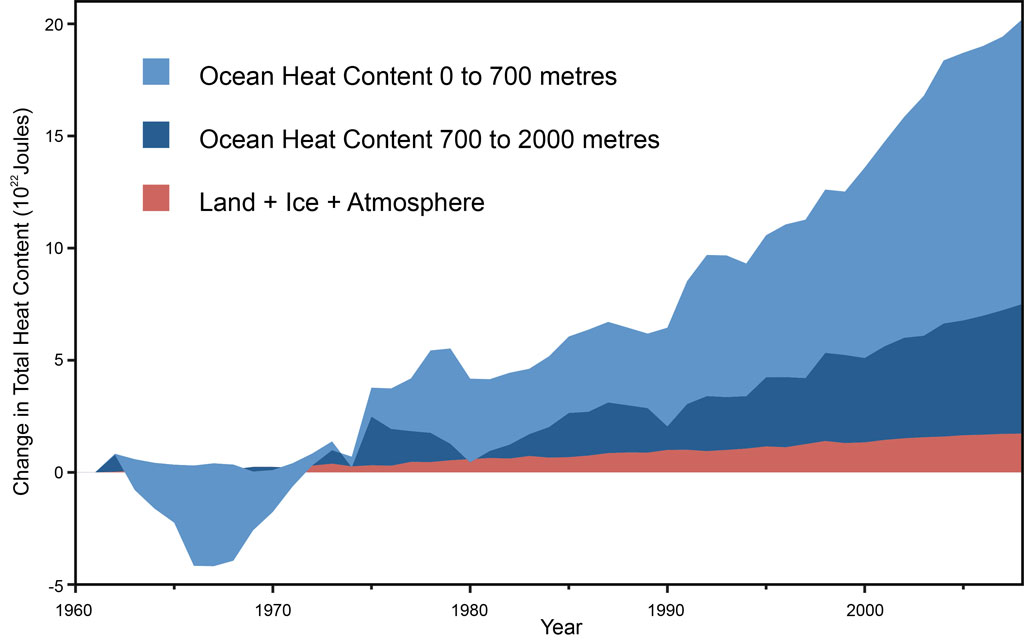
Land, atmosphere, and ice heating (red), 0-700 meter ocean heat content (OHC) increase (light blue), 700-2,000 meter OHC increase (dark blue). From Nuccitelli et al. (2012). | The total heat content of the Earth has been rising at a relatively costant pace since about 1965. Most of the heat (about 80%) has been absorbed by the oceans. | | | Source: Sceptical Science | | URL: http://www.skepticalscience.com/david-rose-hides-rise-global-warming.html |
| National Academy of Sciences - Climate Change: Evidence and Causes | | What is ocean acidification and why does it matter? | 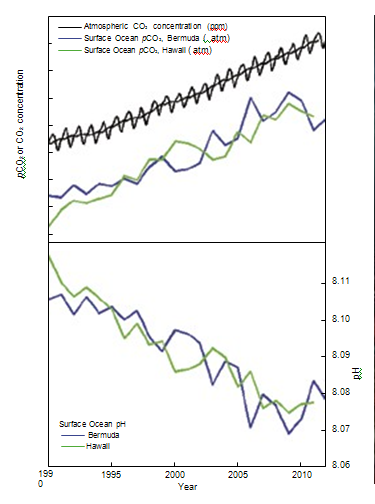
figure 7. As CO2 in the air has
increased, there has been an
increase in the CO2 content of the
surface ocean (upper box), and a
decrease in the seawater pH (lower
box). Source: adapted from Dore et al.
(2009) and Bates et al. (2012). | Direct observations of ocean chemistry have shown that the chemical balance of seawater
has shifted to a more acidic state (lower pH) [Figure 7]. Some marine organisms (such
as corals and some shellfish) have shells composed of calcium carbonate which dissolves
more readily in acid. As the acidity of sea water increases, it becomes more difficult for
them to form or maintain their shells. CO2 dissolves in water to form a weak acid, and the oceans have absorbed about a third of the CO2 resulting
from human activities, leading to a steady decrease in ocean pH levels. With increasing atmospheric CO2,
the chemical balance will change even more during the next century. Laboratory and other experiments
show that under high CO2 and in more acidic waters, some marine species have misshapen shells and
lower growth rates, although the effect varies among species. Acidification also alters the cycling of
nutrients and many other elements and compounds in the ocean, and it is likely to shift the competitive
advantage among species, with as-yet-to-be-determined impacts on marine ecosystems and the food web. | | | Source: NAS | URL: http://dels.nas.edu/resources/static-assets/exec-office-other/climate-change-QA.pdf
(The text for the image(s) on this Web page was taken from the above source.) |
| World Ocean Heat Content 0-700 m - 1955-2010 | 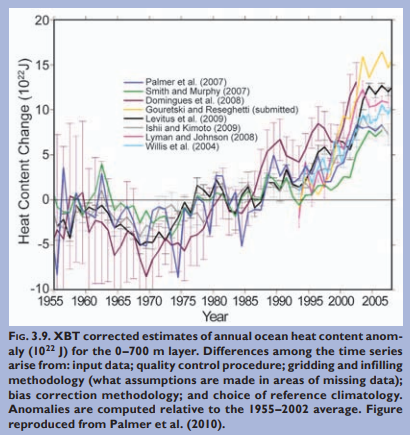
Global Upper Ocean Heat Content is Rising
Time series of seasonal (red dots) and annual average (black line) of global upper ocean heat content for the 0-700m layer since 1955. More information: BAMS State of the Climate in 2009. | While ocean heat content varies significantly from place to place and from year-to-year (as a result of changing ocean currents and natural variability), there is a strong trend during the period of reliable measurements. Increasing heat content in the ocean is also consistent with sea level rise, which is occurring mostly as a result of thermal expansion of the ocean water as it warms. | | | Source: NOAA | URL: https://www1.ncdc.noaa.gov/pub/data/cmb/bams-sotc/2009/bams-sotc-2009-chapter3-global-oceans-lo-rez.pdf
(The text for the image(s) on this Web page was taken from the above source.) |
|
|