Atmosphere
This Fact Page displays text and images related to global warming and climate change
(Hover your mouse over the text below to "popup" a window with a related text.
Click on the text or image to open a new window with a detailed description.)
|
|
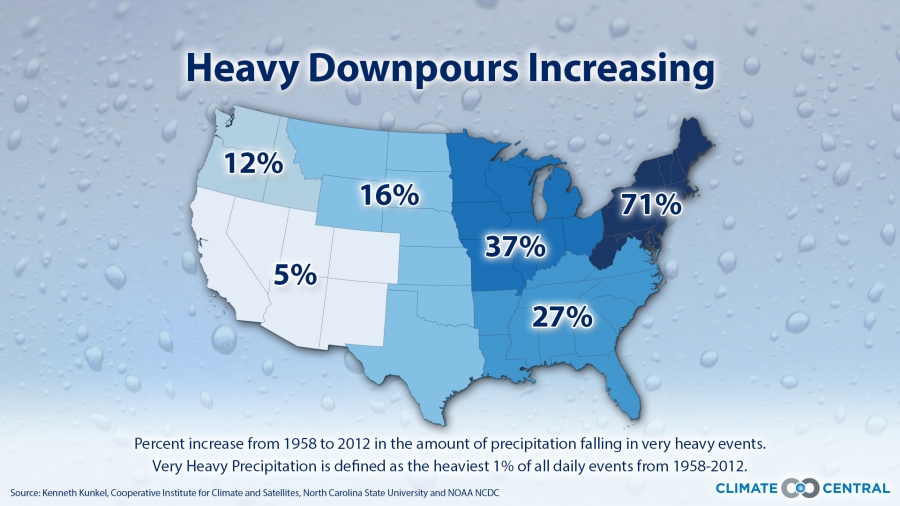
| Increase in Extreme Precipitation Events 1958-2012 | | The warmer atmosphere holds more water (about 4% per degree F) and a likely result has been be the increase in severe precipitation events in the last 50 years in the United States |  | If you get the feeling that heavy downpours are more intense than they used to be, you’re not imagining it. According to the National Climate Assessment, the most extreme precipitation events (those in the 99th percentile of intensity) have increased in every region of the contiguous states since the 1950s. As the map above shows, the rise in intensity has been greatest in the Northeast and least in the Southwest — and in all cases, climate scientists believe, the reason is simple: in a world warmed by heat-trapping greenhouse gases, there’s more evaporation, and the atmosphere can hold on to more water. And when that water vapor condenses as rain or snow, there’s more of it. | | | Source: climatecentral | URL: https://www.climatecentral.org/gallery/maps/extreme-precipitation-events-are-on-the-rise
(The text for the image(s) on this Web page was taken from the above source.) |
| National Academy of Sciences - Climate Change: Evidence and Causes | | Is the current level of atmospheric CO2 concentration unprecedented in Earth’s history? | 
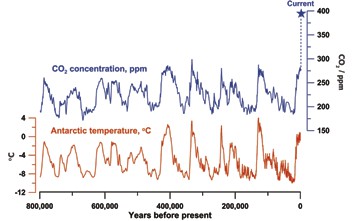
Figure 3. Data from ice cores have
been used to reconstruct Antarctic
temperatures and atmospheric
CO2 concentrations over the past
800,000 years. Temperature is
based on measurements of the
isotopic content of water in the
Dome C ice core. CO2 is measured
in air trapped in ice, and is a
composite of the Dome C and
Vostok ice core. The current CO2
concentration (blue star) is from
atmospheric measurements. The
cyclical pattern of temperature
variations constitutes the ice
age/ interglacial cycles. During
these cycles, changes in CO2
concentrations (in blue) track
closely with changes in temperature
(in red). As the record shows, the
recent increase in atmospheric CO2
concentration is unprecedented
in the past 800,000 years. Source:
Figure by Jeremy Shakun, data from
Lüthi et al., 2008 and Jouzel et al., 2007. | The present level of atmospheric CO2 concentration is almost certainly unprecedented
in the past million years, during which time modern humans evolved and societies
developed. The atmospheric CO2 concentration was however higher in Earth’s more
distant past (many millions of years ago), at which time palaeoclimatic and geological
data indicate that temperatures and sea levels were also higher than they are today. Measurements of air in ice cores show that for the past 800,000 years up until the 20th century, the
atmospheric CO2 concentration stayed within the range 170 to 300 parts per million (ppm), making the recent
rapid rise to nearly 400 ppm over 200 years particularly remarkable [figure 3]. During the glacial cycles of
the past 800,000 years both CO2 and methane have acted as important amplifiers of the climate changes
triggered by variations in Earth’s orbit around the Sun. As Earth warmed from the last ice age, temperature and CO2 started to rise at approximately the same time and continued to rise in tandem from about 18,000 to
11,000 years ago. Changes in ocean temperature, circulation, chemistry and biology caused CO2 to be released
to the atmosphere, which combined with other feedbacks to push Earth into an even warmer state.
For earlier geological times, CO2 concentrations and temperatures have been inferred from less direct
methods. Those suggest that the concentration of CO2 last approached 400 ppm about 3 to 5 million
years ago, a period when global average surface temperature is estimated to have been about 2 to 3.5°C
higher than in the pre-industrial period. At 50 million years ago, CO2 may have reached 1000 ppm, and
global average temperature was probably about 10°C warmer than today. Under those conditions, Earth
had little ice, and sea level was at least 60 metres higher than current levels. | | | Source: NAS | URL: http://dels.nas.edu/resources/static-assets/exec-office-other/climate-change-QA.pdf
(The text for the image(s) on this Web page was taken from the above source.) |
| Total Heat Content (Oceans, Atmosphere, and Land) - 1960-2008 | 
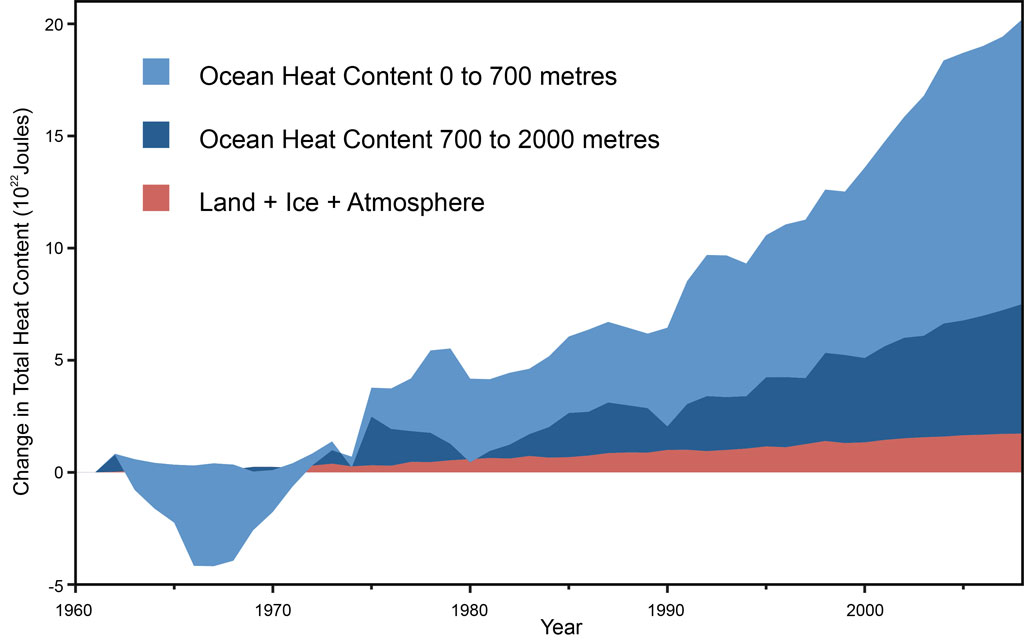
Land, atmosphere, and ice heating (red), 0-700 meter ocean heat content (OHC) increase (light blue), 700-2,000 meter OHC increase (dark blue). From Nuccitelli et al. (2012). | The total heat content of the Earth has been rising at a relatively costant pace since about 1965. Most of the heat (about 80%) has been absorbed by the oceans. | | | Source: Sceptical Science | | URL: http://www.skepticalscience.com/david-rose-hides-rise-global-warming.html |
| National Academy of Sciences - Climate Change: Evidence and Causes | | What do changes in the vertical structure of atmospheric temperature—from the surface up to the stratosphere—tell us about the causes of recent climate change? | | The observed warming in the lower atmosphere and cooling in the upper atmosphere
provide us with key insights into the underlying causes of climate change and reveal that
natural factors alone cannot explain the observed changes. In the early 1960s, results from mathematical/physical models of the climate system first showed that
human-induced increases in CO2 would be expected to lead to gradual warming of the lower atmosphere
(the troposphere) and cooling of higher levels of the atmosphere (the stratosphere). In contrast, increases
in the Sun’s output would warm both the troposphere and the full vertical extent of the stratosphere. At
that time, there was insufficient observational data to test this prediction, but temperature measurements
from weather balloons and satellites have since confirmed these early forecasts. It is now known that the
observed pattern of tropospheric warming and stratospheric cooling over the past 30 to 40 years is broadly
consistent with computer model simulations that include increases in CO2 and decreases in stratospheric
ozone, each caused by human activities. The observed pattern is not consistent with purely natural changes
in the Sun’s energy output, volcanic activity, or natural climate variations such as El Niño and La Niña.
Despite this agreement between the global-scale patterns of modelled and observed atmospheric temperature
change, there are still some differences. The most noticeable differences are in the tropical troposphere,
where models currently show more warming than has been observed, and in the Arctic, where the
observed warming of the troposphere is greater than in most models. | | | Source: NAS | URL: http://dels.nas.edu/resources/static-assets/exec-office-other/climate-change-QA.pdf
(The text for the image(s) on this Web page was taken from the above source.) |
|
|