Greenland
This Fact Page displays text and images related to global warming and climate change
(Hover your mouse over the text below to "popup" a window with a related text.
Click on the text or image to open a new window with a detailed description.)
|
|
| Estimated potential maximum sea-level rise from the total melting of present-day glaciers | | If all of glaciers melt the sea level rise will likely be about 80 meters | 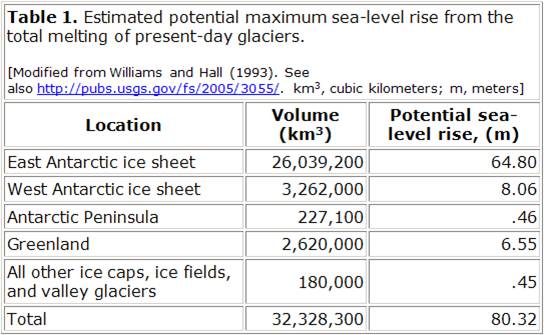 | If Earth’s climate continues to warm, then the volume of present-day ice sheets will decrease. Melting of the current Greenland ice sheet would result in a sea-level rise of about 6.5 meters; melting of the West Antarctic ice sheet would result in a sea-level rise of about 8 meters (table 1). The West Antarctic ice sheet is especially vulnerable, because much of it is grounded below sea level. Small changes in global sea level or a rise in ocean temperatures could cause a breakup of the two buttressing ice shelves (Ronne/Filchner and Ross). The resulting surge of the West Antarctic ice sheet would lead to a rapid rise in global sea level. Reduction of the West Antarctic and Greenland ice sheets similar to past reductions would cause sea level to rise 10 or more meters. A sea-level rise of 10 meters would flood about 25 percent of the U.S. population, with the major impact being mostly on the people and infrastructures in the Gulf and East Coast States (fig. 3). Researchers at the U.S. Geological Survey and elsewhere are investigating the magnitude and timing of sea-level changes during previous interglacial intervals. Better documentation and understanding of these past changes will improve our ability to estimate the potential for future large-scale changes in sea level. | | | Source: USGS | URL: http://pubs.usgs.gov/fs/fs2-00/
(The text for the image(s) on this Web page was taken from the above source.) |
| Greenland Ice Sheet Mass 1992 - 2012 | 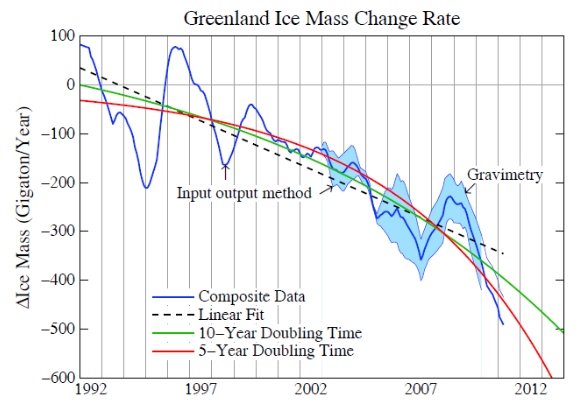
Is Climate Change causing an exponential rate of Ice sheet Mass Loss, sea level rise? | Climate scientist James Hansen and his colleague Makiko Sato have released a new discussion paper with updated data on ice sheet mass loss from Greenland and Antarctica, with implications for possible multi-metre sea level rise this century. It makes for some interesting reading - there is a link to Hansen's website and the paper at the end.
The thesis that Hansen has put forward for several years is that Ice Sheet collapse is a non-linear process: that with the inclusion of amplifying climate feedbacks it is likely to follow an exponential rate of acceleration - a doubling rate. It might be a 10 year doubling time, or less. This will lead to extensive sea level rise, perhaps in the order of 5 metres this century.
But accurate data measurements of ice mass loss via laboriously estimating mass input and output has only been available since the early 1990s, and accurate satellite measurements (Gravimetry) via the GRACE satellites since 2000.
What these measurements show is that ice mass loss from both Greenland and Antarctica are accelerating, but the data for the time period is still too short to determine whether ice sheet mass loss will follow a somewhat linear path, or an exponential path doubling every 10 years or shorter time period. | | URL: http://takvera.blogspot.com/2012_12_01_archive.html
(The text for the image(s) on this Web page was taken from the above source.) |
| Mean cumulative mass balance of all reported glaciers (blue line) and the reference glaciers (red line). | 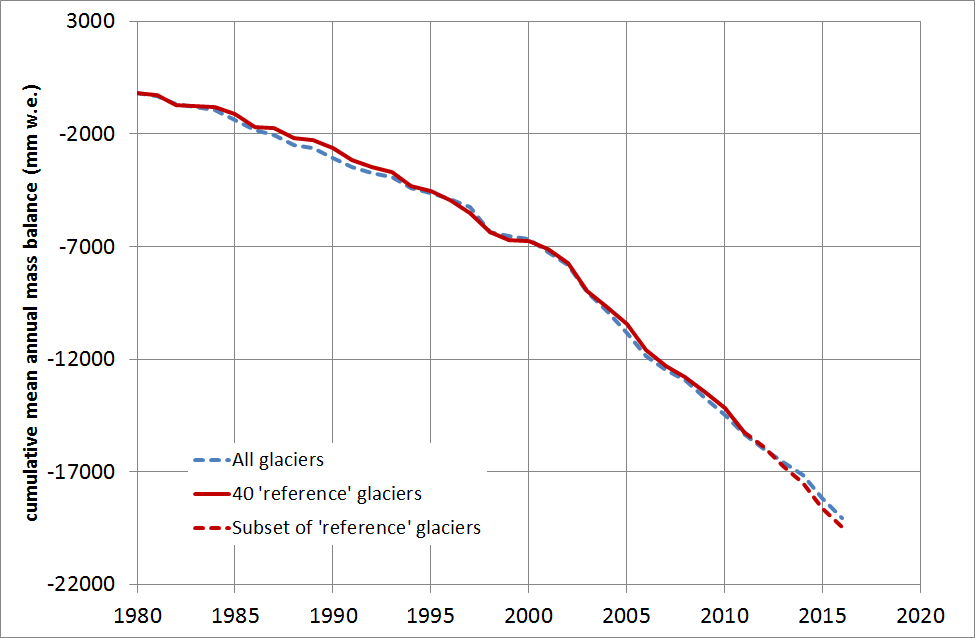
Does not include Greenland or Antarctica | Table 2: Reference glaciers with continuous long-term observation series. Mountain range Glaciers Alaska Gulkana, Wolverine Pacific Coast Ranges Place, South Cascade, Helm, Lemon Creek, Peyto, Columbia (2057) Andes Echaurren Norte Canadian High Arctic Devon Ice Cap NW, Meighen Ice Cap, White, Melville South Ice Cap Svalbard Austre Broeggerbreen, Midtre Lovénbreen Scandinavia Engabreen, Alfotbreen, Nigardsbreen, Grasubreen, Storbreen, Hellstugubreen, Remebesdalsskaaka (Hardangerjoekulen), Storglaciaeren Alps Saint Sorlin, Sarennes, Argentière, Silvretta, Gries, Stubacher Sonnblickkees, Vernagtferner, Kesselwandferner, Hintereisferner, Caresèr, Wurtenkees Caucasus Djankuat Altai No. 125 (Vodopadniy), Maliy Aktru, Leviy Aktru Tien Shan Ts. Tuyuksuyskiy, Urumqi Glacier No.1 | | | Source: world glacier monitoring service | | URL: http://wgms.ch/latest-glacier-mass-balance-data/ |
| Sea level rise contributors | 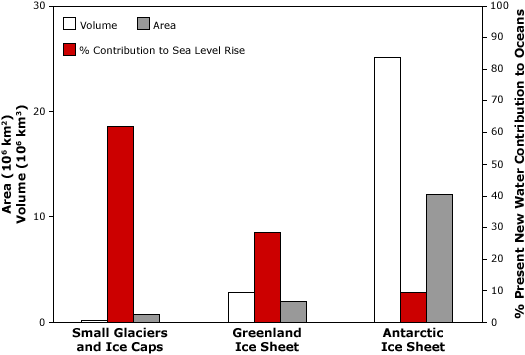
Sea level rise contributors
Comparison of volume (white), area (grey) and percent contribution to sea level rise (red) by small glaciers and ice caps, and the Greenland and Antarctic Ice Sheets. Image courtesy (Meier et al., 2007). | Current conditions: contribution from melting glaciers
Global sea level is currently rising as a result of both ocean thermal expansion and glacier melt, with each accounting for about half of the observed sea level rise, and each caused by recent increases in global mean temperature. For the period 1961-2003, the observed sea level rise due to thermal expansion was 0.42 millimeters per year and 0.69 millimeters per year due to total glacier melt (small glaciers, ice caps, ice sheets) (IPCC 2007). Between 1993 and 2003, the contribution to sea level rise increased for both sources to 1.60 millimeters per year and 1.19 millimeters per year respectively (IPCC 2007).
Antarctica and Greenland, the world's largest ice sheets, make up the vast majority of the Earth's ice. If these ice sheets melted entirely, sea level would rise by more than 70 meters. However, current estimates indicate that mass balance for the Antarctic ice sheet is in approximate equilibrium and may represent only about 10 percent of the current contribution to sea level rise coming from glaciers. However, some localized areas of the Antarctic have recently shown significant negative balance, e.g., Pine Island and Thwaites Glaciers, and glaciers on the Antarctic Peninsula. There is still much uncertainty about accumulation rates in Antarctica, especially on the East Antarctic Plateau. The Greenland Ice Sheet may be contributing about 30 percent of all glacier melt to rising sea level. Furthermore, recent observations show evidence for increased ice flow rates in some regions of the Greenland Ice Sheet, suggesting that ice dynamics may be a key factor in the response of coastal glaciers and ice sheets to climate change and their role in sea level rise.
In contrast to the polar regions, the network of lower latitude small glaciers and ice caps, although making up only about four percent of the total land ice area or about 760,000 square kilometers, may have provided as much as 60 percent of the total glacier contribution to sea level change since 1990s (Meier et al. 2007). | | | Source: NSIDC | URL: https://nsidc.org/cryosphere/sotc/sea_level.html
(The text for the image(s) on this Web page was taken from the above source.) |
| Soot from forest fires contributed to unusually large Greenland surface melt in 2012 | 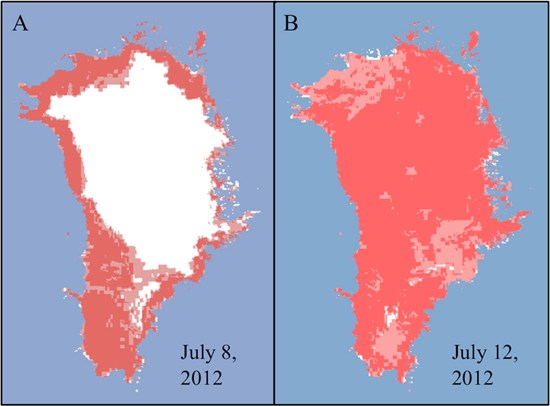
Greenland surface melt on two separate days in July 2012, the latter after high temperatures and soot from forest fires triggered widespread melting. Image courtesy of Dorothy Hall, NASA/GSFC. Source: Keegan et al., ( 2014) | Surface melting doesn't contribute to sea level rise because the water percolates back into the snow and refreezes. But it does reduce the reflectivity of the ice, known as albedo, with consequences for how much sunlight the Arctic region absorbs, and how much ice stays frozen.
Together, with soot which also decreases reflectivity, the ice albedo was pushed below a certain threshold in 1889 and 2012, making it vulnerable to rapid ice loss, say the authors. Lead author Kaitlin Keegan explains such big surface melting events won't be out of place by 2100:
"With both the frequency of forest fires and warmer temperatures predicted to increase with climate change, widespread melt events are likely to happen much more frequently in the future." | | URL: http://www.carbonbrief.org/blog/2014/05/ice-picks-five-pieces-of-ice-news-revealing-earth%E2%80%99s-ice-cover-is-in-serious-decline/
(The text for the image(s) on this Web page was taken from the above source.) |
| The Greenland ice sheet could melt faster than scientists first thought | | The Greenland ice sheet could melt faster than scientists first thought | 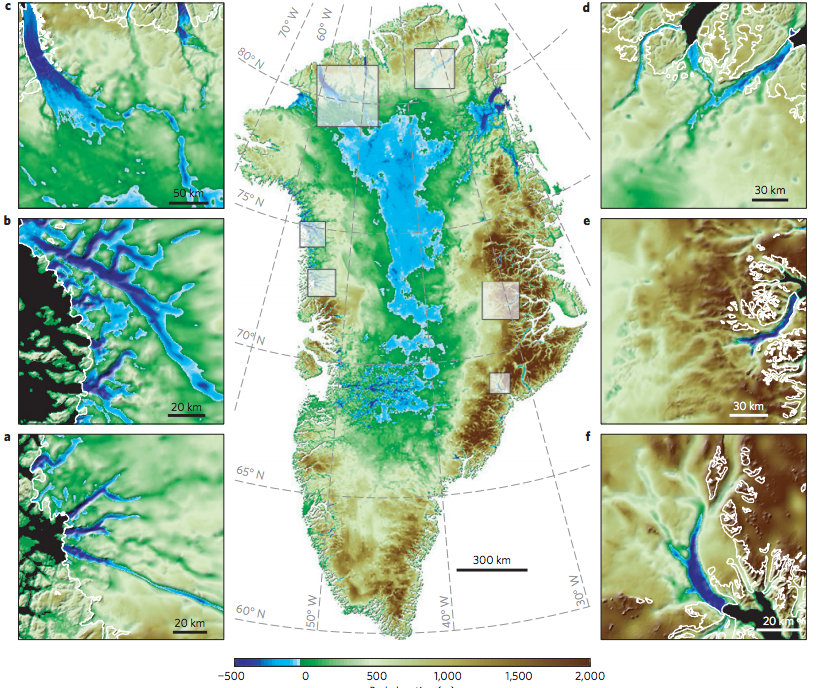
Map of Greenland elevation: Ice covered areas that sit below sea level are marked in blue. Smaller images show individual glaciers and submarine trenches. Source: Morlighem et al. ( 2014). | The Greenland ice sheet may be more vulnerable to climate change than previously thought, scientists reported in a Nature Geoscience paper on Sunday.
The team of US scientists discovered deep channels extending horizontally below the surface of the Greenland sheet, which mean large parts of the glaciers lie on land that's below sea level.
Just like in West Antarctic glaciers, warm water coming into contact with the edge of the glacier forms vast pools under the ice sheet, melting it from the bottom up, the paper explains. | | | Source: carbonbrief | URL: http://www.carbonbrief.org/blog/2014/05/ice-picks-five-pieces-of-ice-news-revealing-earth%E2%80%99s-ice-cover-is-in-serious-decline/
(The text for the image(s) on this Web page was taken from the above source.) |
|
|