Sea Level
This Fact Page displays text and images related to global warming and climate change
(Hover your mouse over the text below to "popup" a window with a related text.
Click on the text or image to open a new window with a detailed description.)
|
|
| | | | | | | | | | | | | | | | | | | | | | | | | | | | | | | | | | | | | | | | | | | | | | | | | | | | Sea Level Deviation - 1870-2010Global mean sea level has been rising at an average rate of approximately 1.7 mm/year over the past 100 years (measured from tide gauge observations), which is significantly larger than the rate averaged over the last several thousand years. Since 1993, global sea level has risen at an accelerating rate of around 3.5 mm/year. Much of the sea level rise to date is a result of increasing heat of the ocean causing it to expand. It is expected that melting land ice (e.g. from Greenland and mountain glaciers) will play a more significant role in contributing to future sea level rise. | | | | | | | | | | | | | | | | | | | | | | | | | | | | | | | | | | | | | | |
| Antarctic ice melt is twice as fast as ten years ago | | Antarctic ice melt is twice as fast as ten years ago | 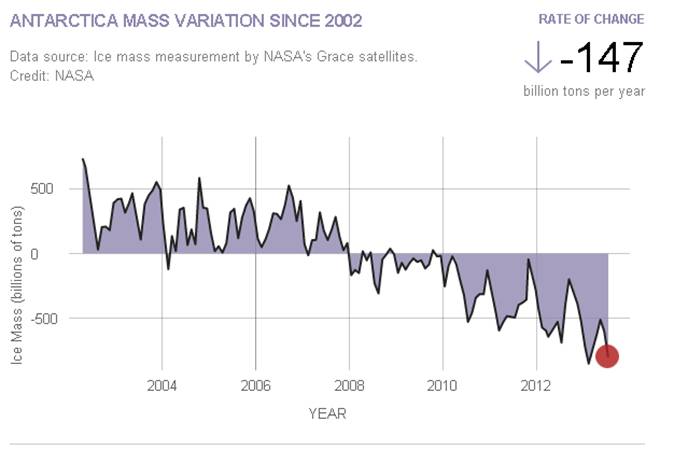
Image source: http://climate.nasa.gov/vital-signs/land-ice/ | 'Antarctic ice losses have DOUBLED in less than a decade with 159 billion tonnes of ice melting each year', reads today's Daily Mail headline. The Guardian opts for, 'Doubling of Antarctic ice loss revealed by European satellite'. The Times says 'Antarctic melt rate worries scientists'.
All three headlines stem from a paper published yesterday in Geophysical Research Letters, which finds the volume of ice melting into the ocean from Antarctica is twice as large the average between 1992 and 2011, now raising global sea levels by 0.45 millimetres a year.
The University of Leeds scientists study uses three years of data from the European Space Agency's CryoSat-2 satellite, launched in 2010. The satellite now sees five times as much area as before, totalling 96 per cent of the total Antarctic continent.
David Vaughan from the British Antarctic Survey told The Guardian why this is so important:
"Through some very clever technical improvements, [the scientists] have produced the best maps of Antarctic ice-loss we have ever had. Prediction of the rate of future global sea-level rise must be begin with a thorough understanding of current changes in the ice sheets - this study puts us exactly where we need to be."
Across Antarctica, the average height of the ice is dropping by 1.9 centimetres per year, the data shows. East Antarctica is staying roughly the same but West Antarctica is seeing big losses, where ice melt is 31 per cent faster now than between 2005 and 2011. Ice loss from glaciers along the Amundsen coast has tripled over the past two decades, the paper explains. | | | Source: carbonbrief | URL: http://www.carbonbrief.org/blog/2014/05/ice-picks-five-pieces-of-ice-news-revealing-earth%E2%80%99s-ice-cover-is-in-serious-decline/
(The text for the image(s) on this Web page was taken from the above source.) |
| Union of Concerned Scientists | | Contributions to Sea Level Rise (1993-2008 Average) | 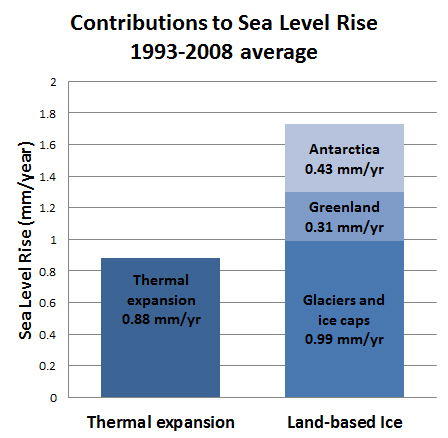 | For most of the last century, thermal expansion from simply heating up the ocean was the main contributor to the global rise in sea level. But that’s changed in the last two decades.
A recent study shows melting of land-based ice and the resulting runoff into the sea now accounts for twice as much sea level rise as thermal expansion does. More than half of the contribution from land-based ice is from melting of alpine glaciers and ice caps, while Greenland and Antarctica (both ice sheets) account for the rest. | | | Source: UCS | | URL: http://blog.ucsusa.org/disappearing-glaciers-melting-ice-sheets-and-rising-seas-to-be-highlighted-in-forthcoming-ipcc-report-232 |
| Cross-plot of estimates of atmospheric CO2 and coinciding sea level | 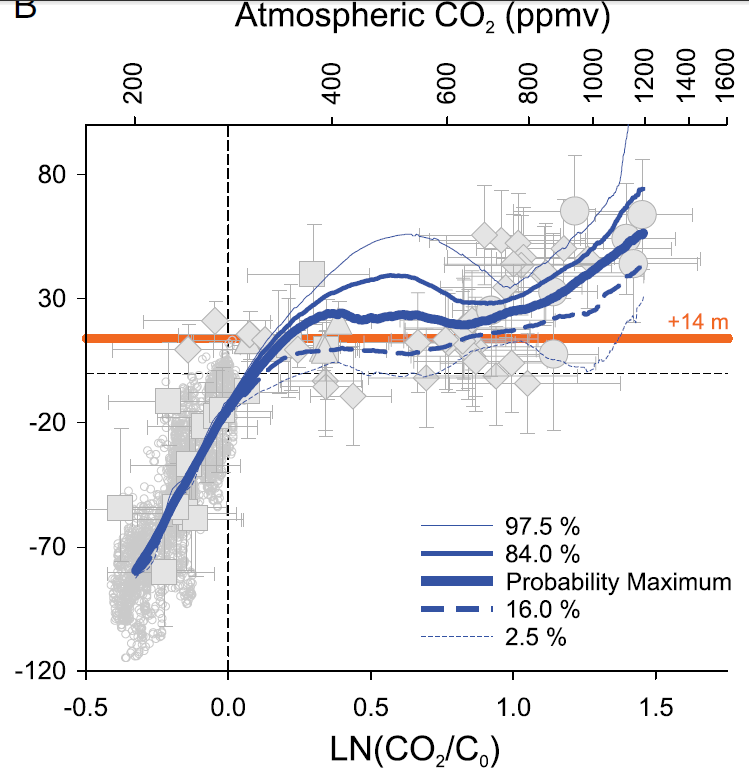
Cross-plot of estimates of atmospheric CO2 and coinciding sea level… (B) Results from our probabilistic analysis of the data that fully accounts for uncertainty in both X and Y parameters … dotted lines denote the preindustrial conditions of 0 m and 280 ppm CO2. The horizontal orange line shows +14 m, which is the sea-level rise associated with the total melting of WAIS and GrIS (31). (WAIS= West Antarctic Ice Sheet, GrIS=Greenland Ice Sheet) Source: “Relationship between sea level and climate forcing by CO2 on geological timescales”, Gavin L. Foster and Eelco J. Rohling, Sept 2012 - | | | Source: PNAS | | URL: http://www.pnas.org/content/110/4/1209.figures-only |
| Equilibrium sea level change relative to temperature change | | We are already committed to at least 30 feet of sea level rise, enough to force the evacuation of most coastal cities | 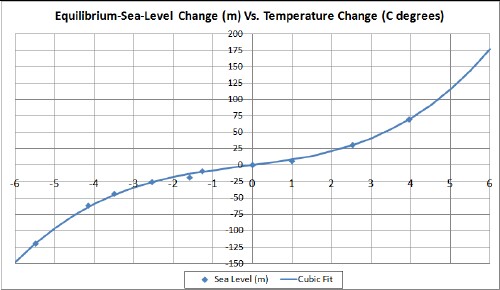
- The point at about -5.5C° is for the Last Glacial Maximum about 20,000 years before present (ybp).
- The point at about -4.2C° is for the minimum about 112,000 ybp.
- The point at about -3.5C° is for the minimum about 89,000 ybp.
- The point at about -2.5C° is for the minimum about 60,000 ybp.
- The point at about -1.6C° is for the maximum about 81,000 ybp.
- The point at about -1.3C° is for the maximum about 106,000 ybp
- The point at about +1C° is for the Eemian geological period (the previous Major Interglacial) about 125,000 years ybp.
- The point slightly above +2.5C° is for the Pliocene geological period about 3x10⁶ ybp.
- The point slightly below +4C° is for the Eocene geological period about 40x106 ybp.
- The points chosen during the last Major Ice Age (125,000 ybp to 20,000 ybp) are for maxima and minima. In the interest of truthfulness, not all the other data points in the 2nd reference fit the curve so well.
| Up to a 2 degree C increase, the expected sea level rise is about 10 meters per degree C (8 feet per degree F) | | | Source: L. David Roper | | URL: http://www.roperld.com/science/sealevelvstemperature.htm |
| Estimated potential maximum sea-level rise from the total melting of present-day glaciers | | If all of glaciers melt the sea level rise will likely be about 80 meters | 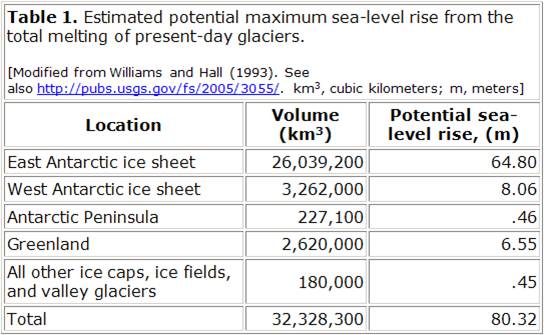 | If Earth’s climate continues to warm, then the volume of present-day ice sheets will decrease. Melting of the current Greenland ice sheet would result in a sea-level rise of about 6.5 meters; melting of the West Antarctic ice sheet would result in a sea-level rise of about 8 meters (table 1). The West Antarctic ice sheet is especially vulnerable, because much of it is grounded below sea level. Small changes in global sea level or a rise in ocean temperatures could cause a breakup of the two buttressing ice shelves (Ronne/Filchner and Ross). The resulting surge of the West Antarctic ice sheet would lead to a rapid rise in global sea level. Reduction of the West Antarctic and Greenland ice sheets similar to past reductions would cause sea level to rise 10 or more meters. A sea-level rise of 10 meters would flood about 25 percent of the U.S. population, with the major impact being mostly on the people and infrastructures in the Gulf and East Coast States (fig. 3). Researchers at the U.S. Geological Survey and elsewhere are investigating the magnitude and timing of sea-level changes during previous interglacial intervals. Better documentation and understanding of these past changes will improve our ability to estimate the potential for future large-scale changes in sea level. | | | Source: USGS | URL: http://pubs.usgs.gov/fs/fs2-00/
(The text for the image(s) on this Web page was taken from the above source.) |
| Expert range of sea-level rise forecasts for 2100 and 2300 |  | A few points stand out here:
-- These values are higher than the "consensus" view from the Intergovernmental Panel on Climate Change. The IPCC projected an 0.5 to 1.0 meter rise by 2100 in the case of unchecked warming. This survey offers higher values, with a 1.5 meter rise possible at the upper end. Why the difference?
Some back story: There are a variety of approaches that scientists take to model sea-level rise. First are "process-based" models that try to capture all the various physical phenomena that can cause ocean levels to creep upward (such as shrinking ice sheets in Greenland and Antarctica, groundwater pumping, the expansion of water due to extra heat). The problem? It's difficult to capture all of these processes precisely, particularly those involving ice.
Alternatively, there are "semi-empirical" models that look at how sea levels have changed with temperature in the past and try to project that forward. These models tend to be far more accurate in reproducing past changes in sea-level, which is a plus. They also tend to project even higher sea-level rise in the future than the process models. But they also have drawbacks: What if the relationship between temperature and sea level changes in the future?
The IPCC didn't rule these "semi-empirical" models out entirely. It simply concluded that it can't assess their reliability. That's why it ended up assuming — cautiously — a lower range for sea-level rise. | | | Source: washingtonpost | | URL: http://www.washingtonpost.com/blogs/wonkblog/wp/2013/11/26/how-high-will-sea-levels-rise-lets-ask-the-experts/ |
| Climate Change Trends (as of 2019 or 2020) | | Global Ocean Heat Content 1979-2020 (relative to 1981-2010) | 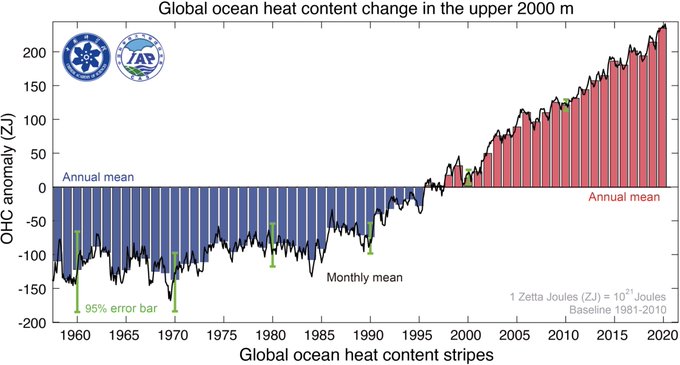
1979: near -100 Zettajoules; 2020: near +250 Zettajoules (+350 ZJ)
Sea Level Rise 1979-2020 (relative to 1880) | | | URL: https://www.patreon.com/posts/climate-change-46574708 |
| National Academy of Sciences - Climate Change: Evidence and Causes | | How fast is sea level rising? | 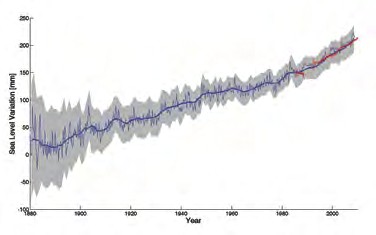
figure 6. Observations show that
the global average sea level has
risen by about 20 cm (8 inches)
since the late 19th century. Sea level
is rising faster in recent decades;
measurements from tide gauges
(blue) and satellites (red) indicate
that the best estimate for the
average sea level rise over the last
two decades is centred on 3.2 mm
per year (0.12 inches per year). The
shaded area represents the sea level
uncertainty, which has decreased as
the number of gauge sites used in
the global averages and the number
of data points have increased.
Source: Shum and Kuo (2011) | Long-term measurements of tide gauges and recent satellite data show that global sea
level is rising, with best estimates of the global-average rise over the last two decades
centred on 3.2 mm per year (0.12 inches per year). The overall observed rise since 1901 is
about 20 cm (8 inches) This sea-level rise has been driven by (in order of importance): expansion of water volume as the ocean
warms, melting of mountain glaciers in most regions of the world, and losses from the Greenland and
Antarctic ice sheets. All of these result from a warming climate. Fluctuations in sea level also occur due to
changes in the amounts of water stored on land. The amount of sea level change experienced at any given
location also depends on a variety of other factors, including whether regional geological processes and
rebound of the land weighted down by previous ice sheets are causing the land itself to rise or sink, and
whether changes in winds and currents are piling ocean water against some coasts or moving water away.
The effects of rising sea level are felt most acutely in the increased frequency and intensity of occasional
storm surges. If CO2 and other greenhouse gases continue to increase on their current trajectories, it is
projected that sea level may rise by a further 0.5 to 1 m (1.5 to 3 feet) by 2100. But rising sea levels will
not stop in 2100; sea levels will be much higher in the following centuries as the sea continues to take up
heat and glaciers continue to retreat. It remains difficult to predict the details of how the Greenland and
Antarctic Ice Sheets will respond to continued warming, but it is thought that Greenland and perhaps West
Antarctica will continue to lose mass, whereas the colder parts of Antarctica could start to gain mass as
they receive more snowfall from warmer air that contains more moisture. Sea level in the last interglacial
(warm) period around 125,000 years ago peaked at probably 5 to 10 m above the present level. During this
period, the polar regions were warmer than they are today. This suggests that, over millennia, long periods
of increased warmth will lead to very significant loss of parts of the Greenland and Antarctic Ice Sheets and
to consequent sea level rise. | | | Source: NAS | URL: http://dels.nas.edu/resources/static-assets/exec-office-other/climate-change-QA.pdf
(The text for the image(s) on this Web page was taken from the above source.) |
| IPCC Sea Level 2100 - All Scenarios | 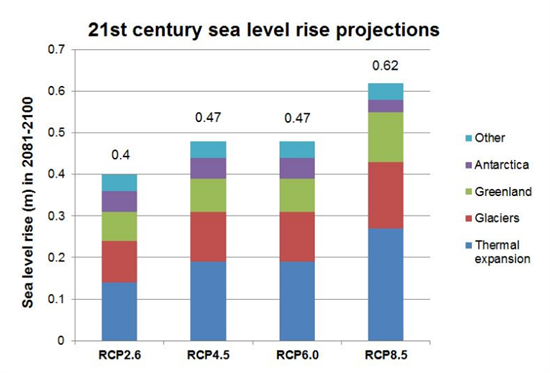
Image by Carbon Brief, created using data in Table 13.5 - Chapter 13 of the IPCC's Fifth Assessment Report. | Under all scenarios, the expansion of water as it warms is the biggest cause of sea level rise - accounting for between 30 and 55 per cent of the increase. The oceans have absorbed more than 90 per cent of the heat trapped by greenhouse gas emissions since the 1970s. As temperatures rise, more heat will enter the sea, which means water will expand further.
Glacier melt is predicted to be the next biggest contributor to future sea level rise. Glacier melting is already speeding up and almost all the world's glaciers are shrinking, says the IPCC. Under the highest emissions scenario, RCP8.5, ice loss from glaciers could drive sea levels up by as much as 16cm by the end of the century.
Melting of the Greenland ice sheet, including surface melt, is expected to be the next biggest driver of sea level rise. Like many other ice-covered regions, Greenland's ice loss is speeding up. Between 1992 and 2001 the ice sheet was losing 34 billion tonnes of ice per year, but between 2002-2011 that increased six-fold to 215 billion tonnes per year. Under the highest emissions scenario RCP8.5, Greenland's shrinking ice is expected to raise sea levels 12cm by the end of the century.
Projecting future ice loss from Antarctica is harder, as different regions of the ice sheet are changing in different ways. While solid ice is being lost from parts of the Antarctic Peninsula and in West Antarctica, the surface of the ice sheet is gaining mass as more snow falls on it. Overall, though, models predict it will cause sea levels to rise by about 5cm in most scenarios.
Higher sea levels are possible
Sea level rise of between 26 and 82 centimetres is the range the IPCC considers likely. The report doesn't rule out the possibility of higher sea levels, but says there isn't enough evidence to say what the chances are.
The likely estimates come from models that simulate all the known processes that contribute to sea level rise - and how those processes are likely to be affected if temperatures continue to rise.
Another set of models take a different approach - they look at how sea levels have changed In response to warming in the past and extend the relationship forward in time. These models give much higher projections for how much sea level rise we can expect by the end of the century - up to twice as large as the IPCC report states.
At the moment, however, there is very little agreement among this type of model. So while the new report discusses their estimates, scientists don't consider them reliable enough to include in the overall assessment. | | | Source: CarbonBrief | | URL: http://www.carbonbrief.org/blog/2013/10/what-the-new-ipcc-report-says-about-sea-level-rise/ |
| Local Sea Level Rise and Tidal Flooding, 1970–2012 (Boston, MA; Atlantic City, NJ; Norfolk, VA; Charleston, SC) | 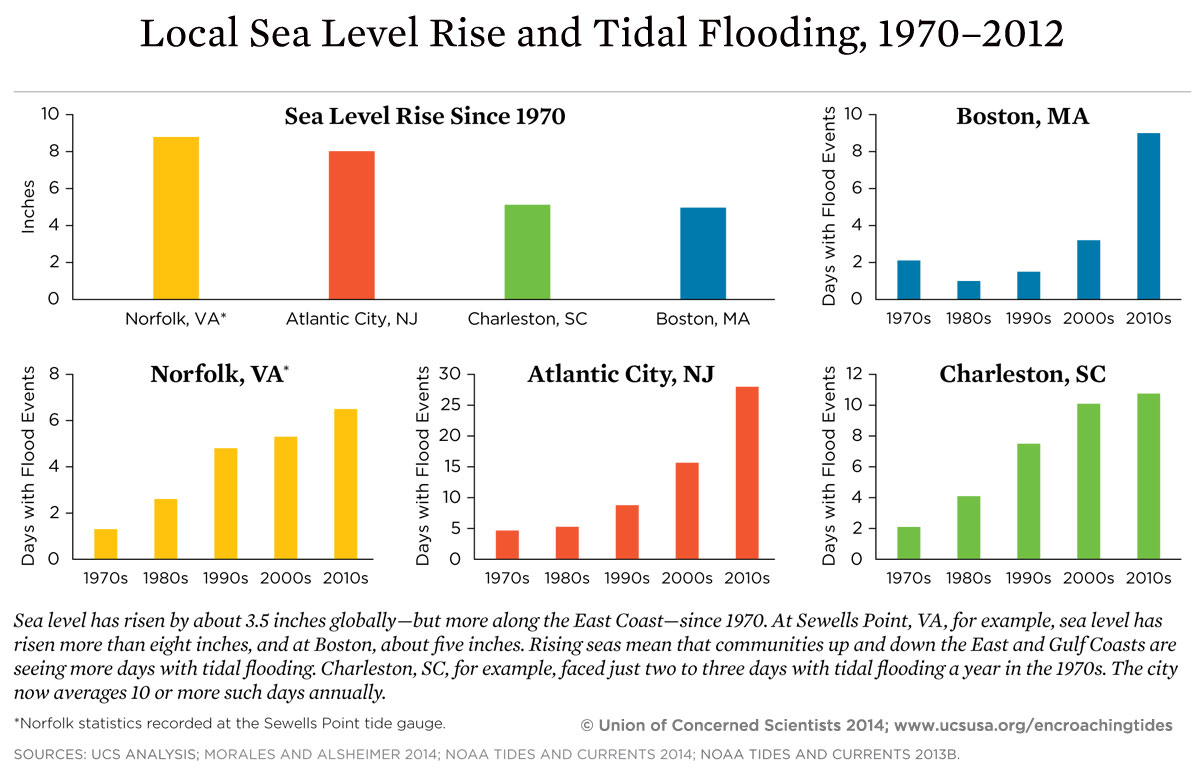 | Flooding during high tides—something that rarely occurred in the past—is now common in some places and is projected to grow to the point that sections of coastal cities may flood so often they would become unusable in the near future, according to a report the Union of Concerned Scientists (UCS) released today, “Encroaching Tides: How Sea Level Rise and Tidal Flooding Threaten U.S. East and Gulf Coast Communities over the Next 30 Years.” | | | Source: ucs | URL: http://www.ucsusa.org/global_warming/impacts/effects-of-tidal-flooding-and-sea-level-rise-east-coast-gulf-of-mexico#.VGjJfTTF9bI
(The text for the image(s) on this Web page was taken from the above source.) |
| Local Sea Level Rise and Tidal Flooding, 1970–2012 (Boston, MA; Atlantic City, NJ; Norfolk, VA; Charleston, SC) | 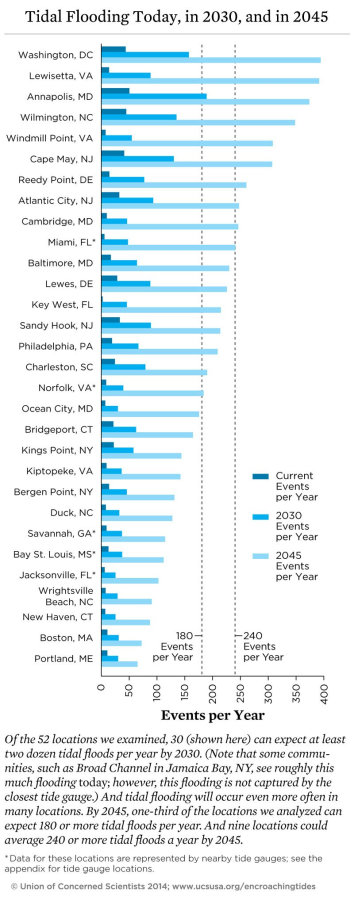 | Flooding during high tides—something that rarely occurred in the past—is now common in some places and is projected to grow to the point that sections of coastal cities may flood so often they would become unusable in the near future, according to a report the Union of Concerned Scientists (UCS) released today, “Encroaching Tides: How Sea Level Rise and Tidal Flooding Threaten U.S. East and Gulf Coast Communities over the Next 30 Years.” Today scores of coastal communities are seeing more frequent flooding during high tides. As sea level rises higher over the next 15 to 30 years, tidal flooding is expected to occur more often, cause more disruption, and even render some areas unusable — all within the time frame of a typical home mortgage. | | | Source: ucs | | URL: http://www.ucsusa.org/global_warming/impacts/effects-of-tidal-flooding-and-sea-level-rise-east-coast-gulf-of-mexico#.VGjJfTTF9bI |
| Map of Miami when sea levels rise 2 meters | 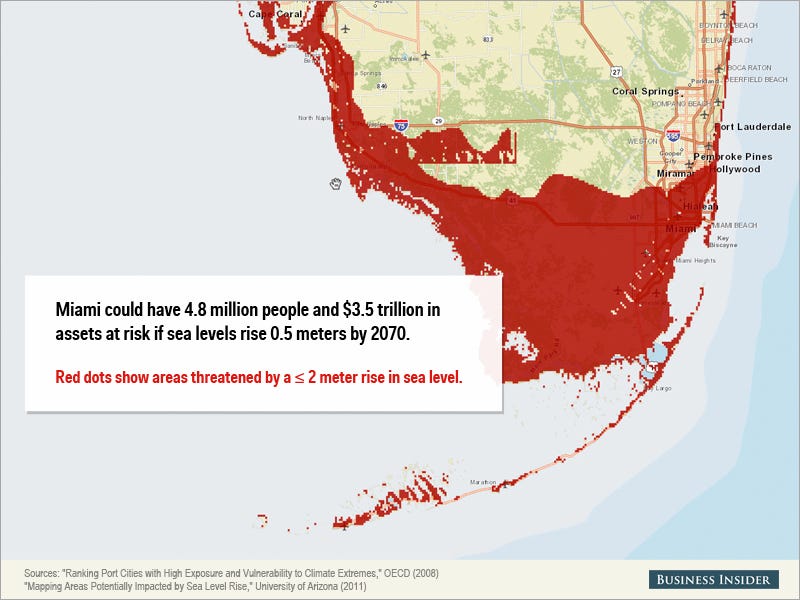
Miami could have 4.8 million people and $3.5 trillion in assets at risk in a major storm if sea levels rise 0.5 meters by 2070, according to a 2008 report from the OECD. The city will face regular and worsening flood and storm damage going forward, and eventually could become an "American Atlantis," Rolling Stone reported last year.
Read more: http://www.businessinsider.com/map-of-miami-when-sea-levels-rise-2014-4#ixzz30VCLaS1b | This Map Shows How Screwed Miami Is If Sea Levels Keep Rising
GUS LUBIN
APR. 23, 2014, 3:24 PM 3,678 20
At a special Senate hearing Tuesday in Miami Beach, Senator Bill Nelson described south Florida as "ground zero" for climate change and its threat to coastal communities, calling for "new, innovative kinds of solutions" and warning that they won't be cheap.
The coming crisis is hard to understate.
Miami could have 4.8 million people and $3.5 trillion in assets at risk in a major storm if sea levels rise 0.5 meters by 2070, according to a 2008 report from the OECD. The city will face regular and worsening flood and storm damage going forward, and eventually could become an "American Atlantis," Rolling Stone reported last year.
The threat is all but imminent as experts predict sea levels will rise about one meter by 2100.
Using a tool from the University of Arizona, we prepared a map showing the parts of south Florida that would be at risk if sea levels rose up to 2 meters (which could happen if sea levels keep rising and there is a major storm):
Read more: http://www.businessinsider.com/map-of-miami-when-sea-levels-rise-2014-4#ixzz30VBwM1ag
| | | Source: Business Insider | URL: http://www.businessinsider.com/map-of-miami-when-sea-levels-rise-2014-4
(The text for the image(s) on this Web page was taken from the above source.) |
| Other ice caps and glaciers in the northern hemisphere are melting faster too | 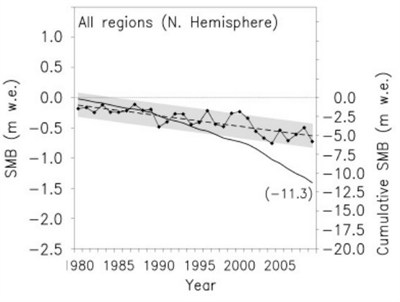
Surface mass balance of ice caps and glaciers in the northern hemisphere - excluding the Greenland Ice Sheet - showing a loss (dashed line) between 1970 and 2009. Annual values are marked by black circles. The solid black line is the cumulative ice loss over the period. Source: Mernild et al., ( 2014) | As well as the Greenland and Antarctic ice sheets, glaciers and ice caps on land are also melting under the pressure of rising temperatures and contributing to sea level rise.
A new paper published today in the Journal of Climate looks at ice-covered areas greater or equal to 0.5 square kilometres in the Northern Hemisphere, excluding the Greenland Ice Sheet.
The researchers built a model of glacier and ice cap responses to past temperature and snowfall changes, testing it against nearly 1500 measurements from 78 locations worldwide.
The scientists estimated the total contribution to sea-level rise from ice caps and glaciers was 0.51 millimetres per year between 1979-2009. But it's speeding up - looking just at the recent decade, 1999-2009, the contribution is 40 per cent higher, at around 0.71 millimetres per year. | | | Source: carbonbrief | URL: http://www.carbonbrief.org/blog/2014/05/ice-picks-five-pieces-of-ice-news-revealing-earth%E2%80%99s-ice-cover-is-in-serious-decline/
(The text for the image(s) on this Web page was taken from the above source.) |
| RCP 8.5 Sea Level rise expected by experts | | Climate science experts expect that significant sea level rise will occurr much sooner that IPCC does | 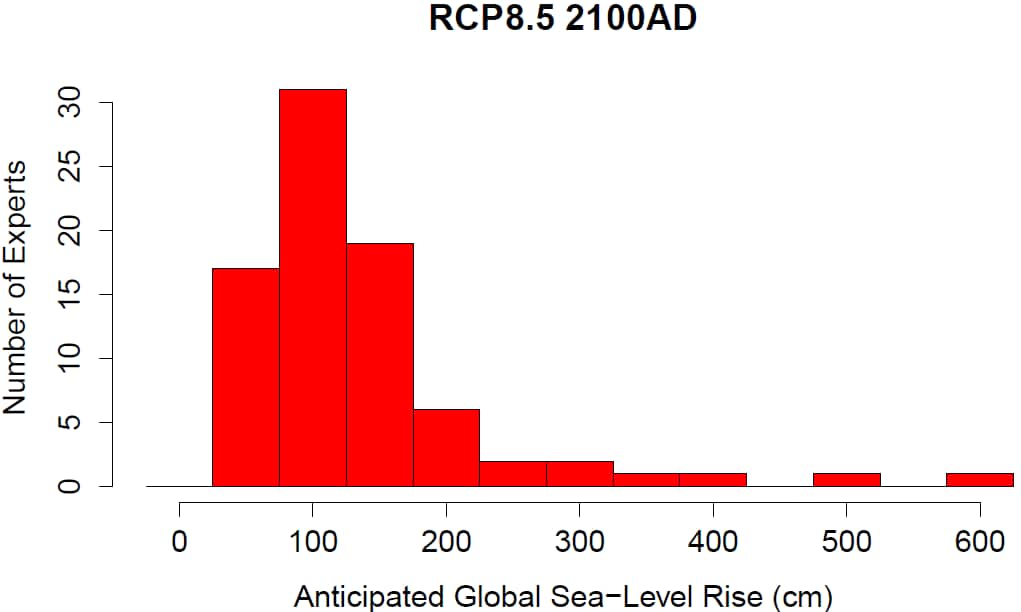
The bulk of experts seem to think we'll see somewhere around 1 meter of sea-level rise by 2100 (some forecasts lower, some higher), if emissions continue unchecked. Then there are about a dozen pessimists worried about even larger rises: | There's not as much polarization among experts as you might think. The chart below comes from Stefan Rahmstorf, one of the authors of the paper. He notes over at Real Climate that there aren't two wildly opposing "camps" of sea-level experts, as press accounts have sometimes suggested. | | | URL: http://www.washingtonpost.com/blogs/wonkblog/wp/2013/11/26/how-high-will-sea-levels-rise-lets-ask-the-experts/ |
| Satellite-based estimates of sea level between 1993 and 2011 (NOAA) | 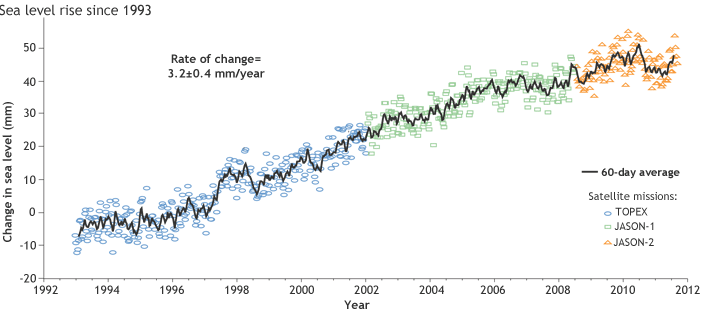 | From the cited public-domain source: "Over the past few decades, tide gauges along the coasts and altimeters on satellites have documented a gradual rise in global average sea level. The graph above shows satellite-based estimates of sea level since 1992. Colored symbols show data collected by successive satellite missions. The average rate of global sea level rise is 3.2 millimeters per year, give or take 0.4 mm. [...] In [2011], global sea levels dipped below the long-term trend of rising sea levels that has been observed in the past few decades. But by late in the year, as La Niña began to phase out, global waters were rising sharply once again. Rising seas are reshaping the world’s coastlines and affecting some of the most densely populated areas on Earth." | | | Source: wikimedia | | URL: https://www.climate.gov/news-features/understanding-climate/state-climate-2011-global-sea-level |
| Sea Level Deviation - 1870-2010 |
Annual averages of global sea level. Red: sea-level since 1870; Blue: tide gauge data; Black: based on satellite observations. The inset shows global mean sea level rise since 1993 - a period over which sea level rise has accelerated. More information: Coastal Sensitivity to Sea Level Rise (USGCRP) and Climate Change 2007: The Physical Science Basis. | Global mean sea level has been rising at an average rate of approximately 1.7 mm/year over the past 100 years (measured from tide gauge observations), which is significantly larger than the rate averaged over the last several thousand years. Since 1993, global sea level has risen at an accelerating rate of around 3.5 mm/year. Much of the sea level rise to date is a result of increasing heat of the ocean causing it to expand. It is expected that melting land ice (e.g. from Greenland and mountain glaciers) will play a more significant role in contributing to future sea level rise. | | | Source: NOAA | URL: http://www.ncdc.noaa.gov/indicators/
(The text for the image(s) on this Web page was taken from the above source.) |
| Sea Level Last 3000 years from selected sites | 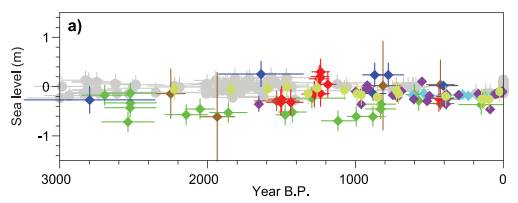
Paleo sea level data for the last 3000 years from Northern and Southern Hemisphere sites. The effects of glacial isostatic adjustment (GIA) have been removed
from these records. Light green = Iceland (Gehrels et al., 2006), purple = Nova Scotia (Gehrels et al., 2005), bright blue = Connecticut (Donnelly et al., 2004), blue = Nova Scotia
(Gehrels et al., 2005), red = United Kingdom (Gehrels et al., 2011), green = North Carolina (Kemp et al., 2011), brown = New Zealand (Gehrels et al., 2008), grey = mid-Pacific
Ocean (Woodroffe et al., 2012). | Since the AR4, there has been significant progress in resolving the sea level history of the last 7000 years. RSL records indicate that from ~7 to 3 ka, GMSL likely rose 2 to 3 m to near present-day levels (Chapter 5). Based on local sea level records spanning the last 2000 years, there is medium confidence that fluctuations in GMSL during this interval have not exceeded ~ ±0.25 m on time scales of a few hundred years (Section 5.6.3, Figure 13.3a). The most robust signal captured in salt marsh records from both Northern and Southern Hemispheres supports the AR4 conclusion for a transition from relatively low rates of change during the late Holocene (order tenths of mm yr–1) to modern rates (order mm yr–1) (Section 5.6.3, Figure 13.3b). However, there is variability in the magnitude and the timing (1840–1920) of this increase in both paleo and instrumental (tide gauge) records (Section 3.7). By combining paleo sea level records with tide gauge records at the same localities, Gehrels and Woodworth (2013) concluded that sea level began to rise above the late Holocene background rate between 1905 and 1945, consistent with the conclusions by Lambeck et al. (2004) | | | Source: IPCC | | URL: http://www.climatechange2013.org/images/report/WG1AR5_Chapter13_FINAL.pdf |
| Sea Level Rise 1870 to 2000 (Tide Gauges) | 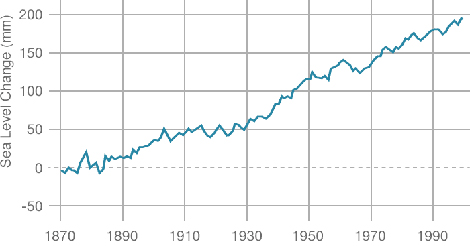 | Sea level rise is caused primarily by two factors related to global warming: the added water from melting land ice and the expansion of sea water as it warms. | | | Source: NASA | | URL: https://climate.nasa.gov/vital-signs/sea-level/ |
| Sea level rise contributors | 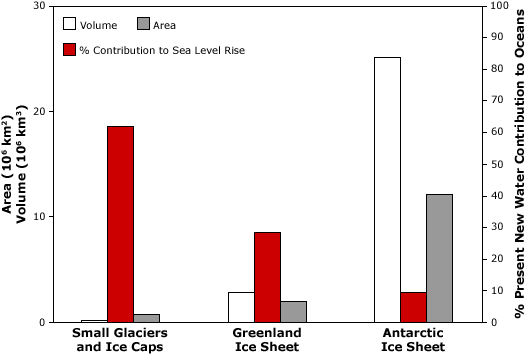
Sea level rise contributors
Comparison of volume (white), area (grey) and percent contribution to sea level rise (red) by small glaciers and ice caps, and the Greenland and Antarctic Ice Sheets. Image courtesy (Meier et al., 2007). | Current conditions: contribution from melting glaciers
Global sea level is currently rising as a result of both ocean thermal expansion and glacier melt, with each accounting for about half of the observed sea level rise, and each caused by recent increases in global mean temperature. For the period 1961-2003, the observed sea level rise due to thermal expansion was 0.42 millimeters per year and 0.69 millimeters per year due to total glacier melt (small glaciers, ice caps, ice sheets) (IPCC 2007). Between 1993 and 2003, the contribution to sea level rise increased for both sources to 1.60 millimeters per year and 1.19 millimeters per year respectively (IPCC 2007).
Antarctica and Greenland, the world's largest ice sheets, make up the vast majority of the Earth's ice. If these ice sheets melted entirely, sea level would rise by more than 70 meters. However, current estimates indicate that mass balance for the Antarctic ice sheet is in approximate equilibrium and may represent only about 10 percent of the current contribution to sea level rise coming from glaciers. However, some localized areas of the Antarctic have recently shown significant negative balance, e.g., Pine Island and Thwaites Glaciers, and glaciers on the Antarctic Peninsula. There is still much uncertainty about accumulation rates in Antarctica, especially on the East Antarctic Plateau. The Greenland Ice Sheet may be contributing about 30 percent of all glacier melt to rising sea level. Furthermore, recent observations show evidence for increased ice flow rates in some regions of the Greenland Ice Sheet, suggesting that ice dynamics may be a key factor in the response of coastal glaciers and ice sheets to climate change and their role in sea level rise.
In contrast to the polar regions, the network of lower latitude small glaciers and ice caps, although making up only about four percent of the total land ice area or about 760,000 square kilometers, may have provided as much as 60 percent of the total glacier contribution to sea level change since 1990s (Meier et al. 2007). | | | Source: NSIDC | URL: https://nsidc.org/cryosphere/sotc/sea_level.html
(The text for the image(s) on this Web page was taken from the above source.) |
| Sea Level Rise Due To Thermal Expansion (for next 500 years) | 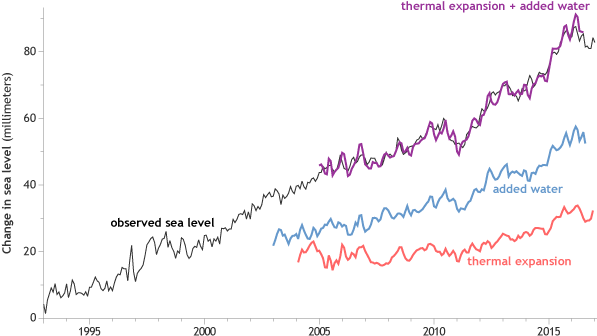
This graph shows the projected change in global sea level rise if atmospheric carbon dioxide (CO2) concentrations were to either quadruple or double. [59] The projection is based on several multi-century integrations of a GFDL global coupled ocean-atmosphere model. These projections are the expected changes due to thermal expansion of sea water alone, and do not include the effect of melted continental ice sheets. With the effect of ice sheets included, the total rise could be larger by a substantial factor.[59] Image credit: NOAA GFDL. | This graph shows the projected change in global sea level rise if atmospheric carbon dioxide (CO2) concentrations were to either quadruple or double. Edited quote from the cited public-domain source: In response to greenhouse gas warming, sea level is expected to rise due to the thermal expansion of sea water as the ocean warms. Because the deep ocean will warm much more slowly than the upper ocean, the thermally driven rise in sea level is expected to continue for centuries after atmospheric CO2 stops increasing. The graph shows the increase of global mean sea level in the GFDL 4xCO2 coupled climate model experiment. Even though CO2 no longer increases after year 140, sea level continues to rise steadily well beyond year 500. The final equilibrium sea level change in the model is 1.9 meters for a CO2 doubling (not shown) which is roughly the level attained in the CO2 quadrupling experiment after 500 years. The equilibrium rise for the quadrupling experiment has not yet been simulated.
These sea level rise projections are the expected changes due to thermal expansion of sea water alone, and do not include the effect of melted continental ice sheets. With the effect of ice sheets included, the total rise could be larger by a substantial factor. However, projections of the contribution of the ice sheets to future sea level rise are not presented here due to the difficulties of performing a credible calculation. For reference, the volume of ice in the Greenland and Antarctica ice sheets is equivalent to a sea level rise of 7 and 73 meters, respectively (IPCC, 1995) (see current sea level rise for more information).
Details on the simulation
The results presented are based on several multi-century integrations of a GFDL global coupled ocean-atmosphere model. The model resolution is about 4 degrees latitude. In the quadrupled (4xCO2) experiment, CO2 increases at 1% per year (compounded) to a level four times that of the present climate. After this 140 year "ramp-up" period, the model is integrated for several more centuries to examine the long time response of the climate system, including the deep ocean. For comparison, results are also presented from the 2xCO2 experiment, in which CO2 increases by a factor or two in the first 70 years, and then is constant at 2xCO2 for several more centuries of model integration. | | | Source: wikipedia | | URL: https://cleanet.org/details/images/188829.html |
| Sea level rise for 1961-2008 (by source) | 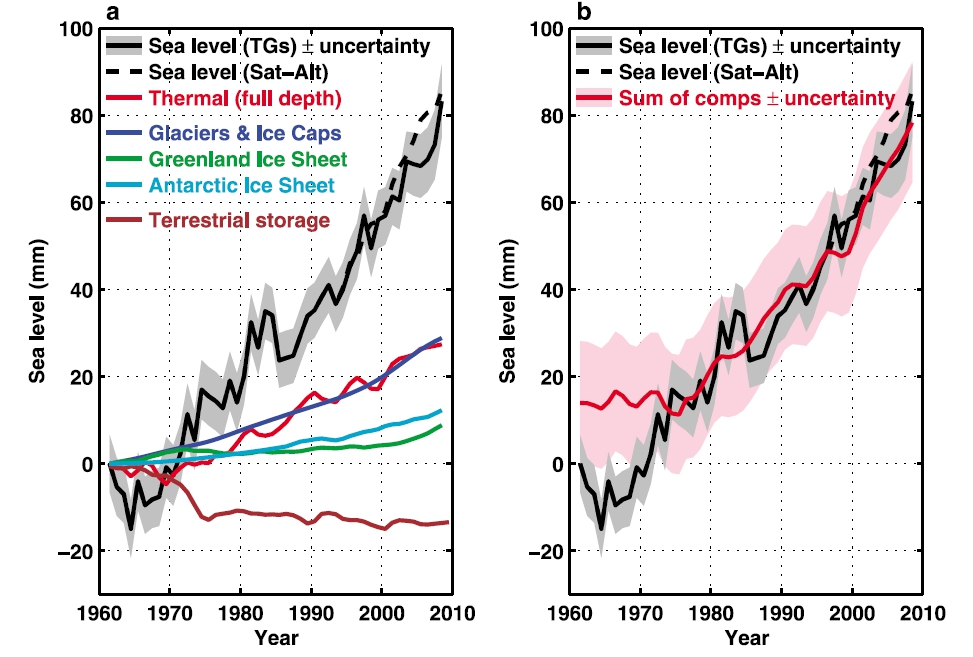 | Last year Church et al. (2011) provided a new sea-level budget analysis (see Fig. 1). For the period 1972-2008 the budget is closed, with a total rise of about 7 cm. A bit over half of that is due to melting land ice, and a bit less than half due to thermal expansion. Land water storage makes a small negative contribution, because the water stored in artificial reservoirs (which lowers sea level) is estimated to be larger than the amount of fossil groundwater pumped up for irrigation (which mostly ends up in the sea). Also for the shorter recent period 1993-2008 (for which we have satellite measurements of global sea level rise, found to be about 3 mm per year) John Church and colleagues successfully closed the sea level budget. Granted, the uncertainties in the estimates are still significant so the issue cannot be considered completely resolved. Nevertheless, the Church et al. paper defines the current state of the art against which all further studies need to measure up. - See more at: http://www.realclimate.org/index.php/archives/2012/06/what-makes-sea-level-rise/#sthash.OqaQ1NvO.dpuf | | | URL: http://www.realclimate.org/index.php/archives/2012/06/what-makes-sea-level-rise/ |
| Small glacier/ice cap contribution | 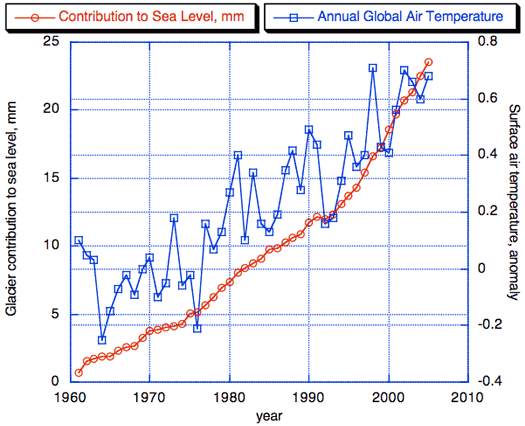
Small glacier/ice cap contribution
The cumulative contribution to sea level from small glaciers and ice caps (red) plotted with the annual global surface air temperature anomaly (blue). Image courtesy Mark Dyurgerov, Institute of Arctic and Alpine Research, University of Colorado, Boulder. | How glaciers' contribution to sea level is computed
Global mass balance data are transformed to sea-level equivalent by first multiplying the ice thickness (meters) lost to melting by the density of ice (about 900 kilograms per cubic meter), to obtain a water equivalent thickness, and then multiplying by the surface area of these "small" glaciers (about 760,000 square kilometers). This provides an annual average mass balance of approximately -0.273 meters for the period 1961 to 2005. When dividing the mass balance value by the surface area of the oceans (361.6 million square kilometers), the final result is 0.58 millimeters of sea level rise per year. The Glacier Contribution to Sea Level graph demonstrates how the contribution from melting glaciers began increasing at a faster rate starting in the 1990s. This is in agreement with high-latitude air temperature records. The IPCC (2013) stated that it was "very likely" (at least 90 percent confidence) that the mean annual global rate of ocean level increase was 1.5 to 1.9 millimeters between 1901 and 2010, 1.7 to 2.3 millimeters between 1971 and 2010, and 2.8 to 3.6 millimeters between 1993 and 2010. | | | Source: NSIDC | URL: https://nsidc.org/cryosphere/sotc/sea_level.html
(The text for the image(s) on this Web page was taken from the above source.) |
| Soot from forest fires contributed to unusually large Greenland surface melt in 2012 | 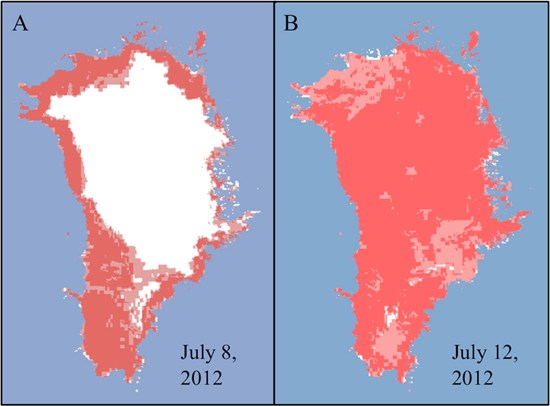
Greenland surface melt on two separate days in July 2012, the latter after high temperatures and soot from forest fires triggered widespread melting. Image courtesy of Dorothy Hall, NASA/GSFC. Source: Keegan et al., ( 2014) | Surface melting doesn't contribute to sea level rise because the water percolates back into the snow and refreezes. But it does reduce the reflectivity of the ice, known as albedo, with consequences for how much sunlight the Arctic region absorbs, and how much ice stays frozen.
Together, with soot which also decreases reflectivity, the ice albedo was pushed below a certain threshold in 1889 and 2012, making it vulnerable to rapid ice loss, say the authors. Lead author Kaitlin Keegan explains such big surface melting events won't be out of place by 2100:
"With both the frequency of forest fires and warmer temperatures predicted to increase with climate change, widespread melt events are likely to happen much more frequently in the future." | | URL: http://www.carbonbrief.org/blog/2014/05/ice-picks-five-pieces-of-ice-news-revealing-earth%E2%80%99s-ice-cover-is-in-serious-decline/
(The text for the image(s) on this Web page was taken from the above source.) |
| Subglacial topography of Antarctica | 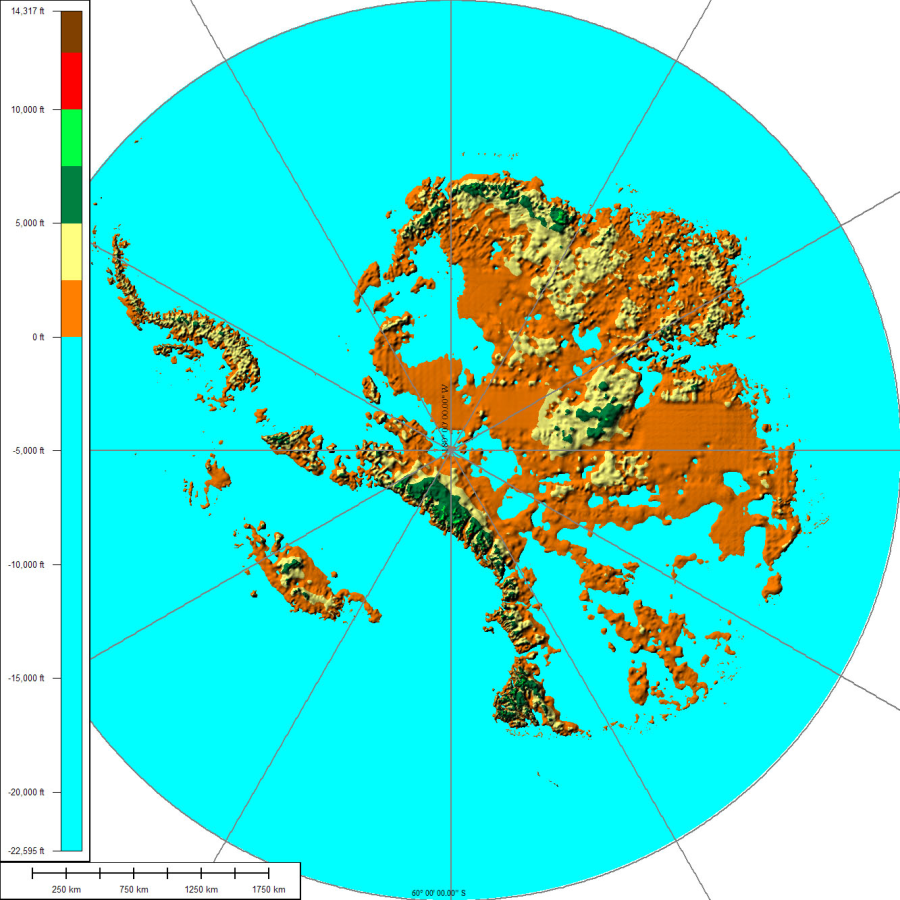
The above map shows the subglacial topography of Antarctica. As indicated by the scale on left-hand side, blue represents portion of Antarctica lying below sea level. The other colors indicate Antarctic bedrock lying above sea level. Each color represents an interval of 2,500 ft (760 m) in elevation. Map is not corrected for sea level rise or isostatic rebound, which would occur if the Antarctic ice sheet completely melted to expose the bedrock surface. | The icing of Antarctica began with ice-rafting from middle Eocene times about 45.5 million years ago[5] and escalated inland widely during the Eocene–Oligocene extinction event about 34 million years ago. CO2 levels were then about 760 ppm[6] and had been decreasing from earlier levels in the thousands of ppm. Carbon dioxide decrease, with a tipping point of 600 ppm, was the primary agent forcing Antarctic glaciation.[7] The glaciation was favored by an interval when the Earth's orbit favored cool summers but Oxygen isotope ratio cycle marker changes were too large to be explained by Antarctic ice-sheet growth alone indicating an ice age of some size.[8] The opening of the Drake Passage may have played a role as well[9] though models of the changes suggest declining CO2 levels to have been more important.[10] | | | Source: Wikipedia | | URL: http://en.wikipedia.org/wiki/Antarctic_ice_sheet |
| Temperature vs Sea Level | 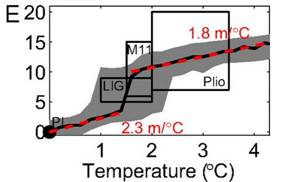
“The multimillennial sea-level commitment of global warming
Meters of sea-level rise plotted against temperature increase. Note that a 2.5 oC temperature increase will likely result in 10-15 meters (30-45 feet) of sea level rise. And even with a 2 oC temperature increase the sea level rise will likely be 10 meters (30 feet) | 1. “ Anders Levermann et al, June 2013 PNAS | | | Source: PNAS | | URL: http://www.pnas.org/content/110/34/13745.full |
| The effects of a 80 meter sea level rise on North America | 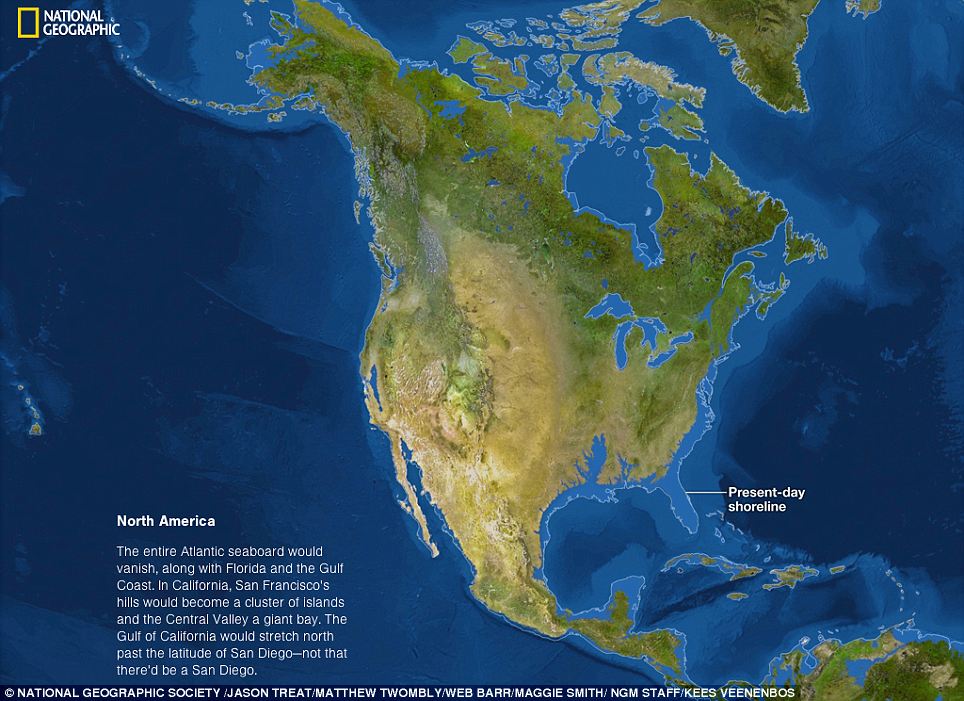
The last time the Earth was ice-free was 34 million years ago during the Eocene epoch. If this happened again, the entire Atlantic seaboard in the U.S would vanish, wiping out Florida and the Gulf Coast. While the hills in San Francisco would become islands and San Diego would be lost forever | Scientists believe it could take around 5,000 years for temperatures to rise significantly enough to melt all the ice on the planet, but claim the planet is already seeing the beginnings of this.
Over the past century, reports suggest the Earth's temperature has increased by around half a degree Celsius and, according to the U.S. Environmental Protection Agency (EPA), this has already caused sea levels to rise by around seven inches.
The largest concentrations of ice on Earth are found in Greenland and Antarctica but it is also found on exposed areas, on mountain tops and in other regions.
The East Antarctica ice sheet, for example, is so large it contains around 80 per cent of all the ice on the planet and its size has protected it previously during warmer periods in Earth’s history.
This includes during the Eocene epoch - a period of increased global temperatures that lasted from 56 to 34 million years ago.
During this period of time, little to no ice was present on Earth and there was little difference in temperature at the equator compared to the poles.
Warming oceans are already melting the floating ice sheet in west Antarctica and since 1992, National Geographic reports the sheet has lost around 65 million metric tonnes of ice each year.
The ice sheets in Greenland and west Antarctica shrank significantly during the epoch and if temperatures were to rise in a similar manner again, the ice sheets across the regions could disappear into the sea completely.
Read more: http://www.dailymail.co.uk/sciencetech/article-2488452/Map-reveals-devastation-worlds-ice-melted.html#ixzz3I6qUExHc
Scientists believe it could take around 5,000 years for temperatures to rise significantly enough to melt all the ice on the planet, but claim the planet is already seeing the beginnings of this.
Over the past century, reports suggest the Earth's temperature has increased by around half a degree Celsius and, according to the U.S. Environmental Protection Agency (EPA), this has already caused sea levels to rise by around seven inches.
The largest concentrations of ice on Earth are found in Greenland and Antarctica but it is also found on exposed areas, on mountain tops and in other regions.
The East Antarctica ice sheet, for example, is so large it contains around 80 per cent of all the ice on the planet and its size has protected it previously during warmer periods in Earth’s history.
This includes during the Eocene epoch - a period of increased global temperatures that lasted from 56 to 34 million years ago.
During this period of time, little to no ice was present on Earth and there was little difference in temperature at the equator compared to the poles.
Warming oceans are already melting the floating ice sheet in west Antarctica and since 1992, National Geographic reports the sheet has lost around 65 million metric tonnes of ice each year.
The ice sheets in Greenland and west Antarctica shrank significantly during the epoch and if temperatures were to rise in a similar manner again, the ice sheets across the regions could disappear into the sea completely. | | | Source: Daily Mail | | URL: http://www.dailymail.co.uk/sciencetech/article-2488452/Map-reveals-devastation-worlds-ice-melted.html |
| The Greenland ice sheet could melt faster than scientists first thought | | The Greenland ice sheet could melt faster than scientists first thought | 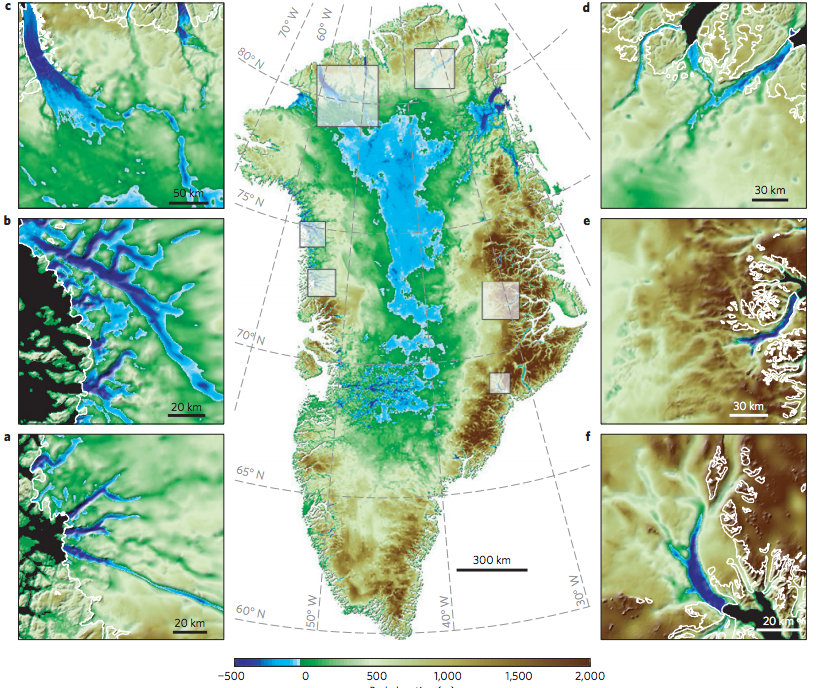
Map of Greenland elevation: Ice covered areas that sit below sea level are marked in blue. Smaller images show individual glaciers and submarine trenches. Source: Morlighem et al. ( 2014). | The Greenland ice sheet may be more vulnerable to climate change than previously thought, scientists reported in a Nature Geoscience paper on Sunday.
The team of US scientists discovered deep channels extending horizontally below the surface of the Greenland sheet, which mean large parts of the glaciers lie on land that's below sea level.
Just like in West Antarctic glaciers, warm water coming into contact with the edge of the glacier forms vast pools under the ice sheet, melting it from the bottom up, the paper explains. | | | Source: carbonbrief | URL: http://www.carbonbrief.org/blog/2014/05/ice-picks-five-pieces-of-ice-news-revealing-earth%E2%80%99s-ice-cover-is-in-serious-decline/
(The text for the image(s) on this Web page was taken from the above source.) |
| West Antarctic glaciers are collapsing, and it's "unstoppable" | 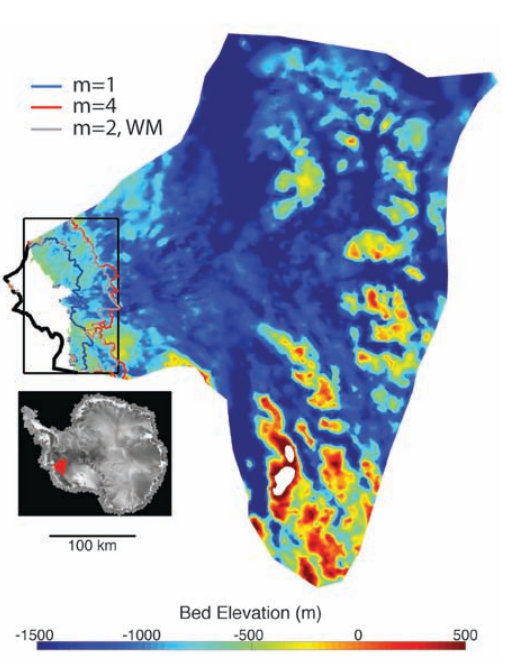
Radar image showing the ice-shelf edge of the Thwaites glacier in West Antarctica (thick black line) and the position of the "grounding line" - where ice meets ocean and goes afloat - under a high warming scenario (red line). Source: Joughin et al,. (2014) | Eye-catching words like "collapse", "irreversible", "unstoppable" and "catastrophic" peppered media coverage last week of two papers charting the demise of West Antarctic glaciers.
The first paper in Science looked at how changes in wind and ocean circulations are bringing warm water in contact with the underside of the Thwaites glacier - one of the biggest in West Antarctica - melting it from the bottom up. Similar things are happening with other glaciers across West Antarctica, explained the second paper in Geophysical Research Letters.
Not only are the glaciers shrinking, but there's nothing to stop them melting completely. That's why scientists are talking about the glaciers' collapse as "irreversible" and "unstoppable".
And without the huge glaciers to prop up the interior of the ice sheet, much larger areas of West Antarctic ice will start slipping into the ocean. This would ultimately raise sea levels by three to four metres, though that would take several centuries, say the scientists.
Here are some key questions on both bits of research answered by experts. | | | Source: carbonbrief | URL: http://www.carbonbrief.org/blog/2014/05/ice-picks-five-pieces-of-ice-news-revealing-earth%E2%80%99s-ice-cover-is-in-serious-decline/
(The text for the image(s) on this Web page was taken from the above source.) |
|
|