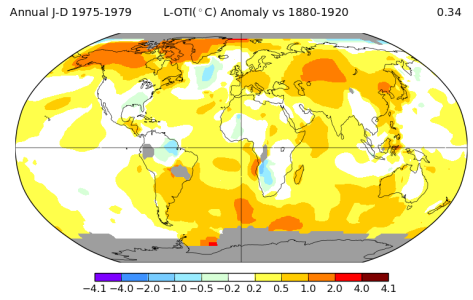
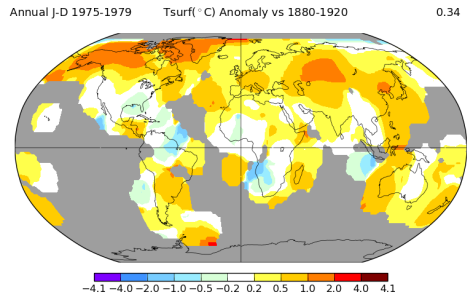
Global Average (Land + Sea) Temperature 1975-1979 (relative to 1880-1920 climatology): ( ) (Temperature )
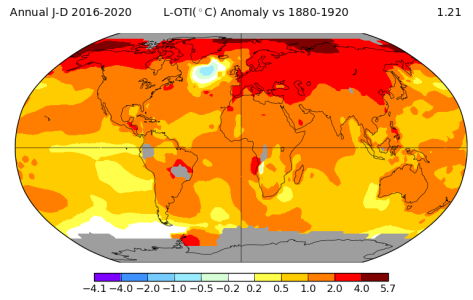
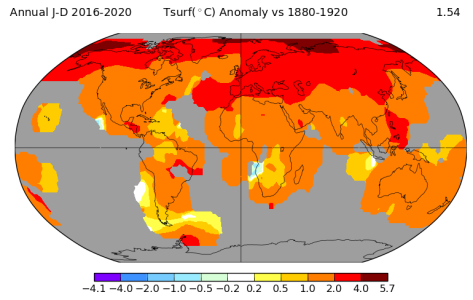
 | Global Average (Land + Sea) Temperature 2016-2020 (relative to 1880-1920 climatology): ( ) (Temperature )
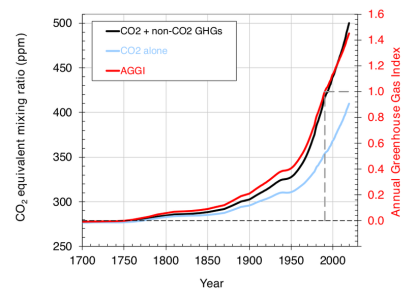
 | Carbon Dioxide Equivalent 1979-2019 (equivalent carbon dioxide concentration taking into account other greenhouse gases, such as methane and nitrous oxide): ( ) (Methane Greenhouse Gases Carbon Dioxide Greenhouse Gases Carbon Dioxide )
 | Machine learning & AI |
Figure 1.Mechanisms influencing WNV transmission. ( ) (Temperature Population )
 | Figure 2.Climate and immunity correlations with annual state WNND cases. ( ) (Temperature Climate Droughts )
 | Figure 3.Climate, immunity and WNND cases. ( ) (Climate )
 | Figure 4.(a) National historical and projected WNND cases. ( ) ()
 |
2018 Oil and Gas Methane Emissions – Distribution (~34 MMTCO2e) ( ) (Methane )
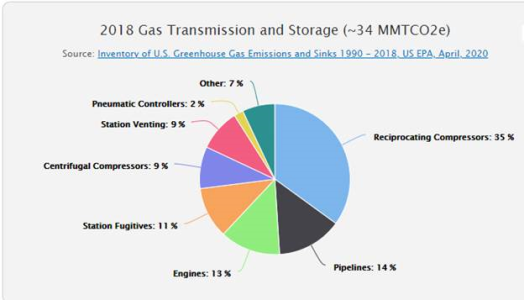
 | 2018 Oil and Gas Methane Emissions – Transmission (~34 MMTCO2e) ( ) (Methane )
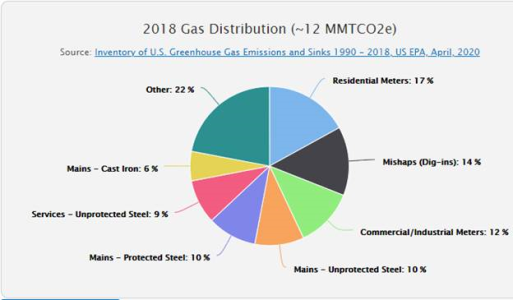
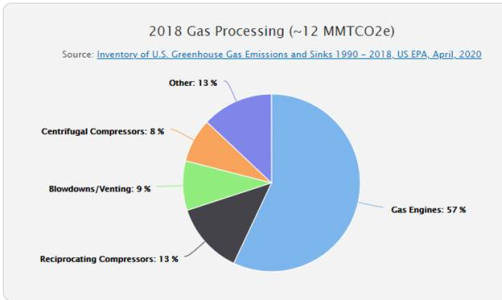
 | 2018 Oil and Gas Methane Emissions - Processing (~12 MMTCO2e) ( ) (Methane )
 | 2018 Oil and Gas Methane Emissions - Production (~117 MMTCO2e) ( ) (Methane )
 |
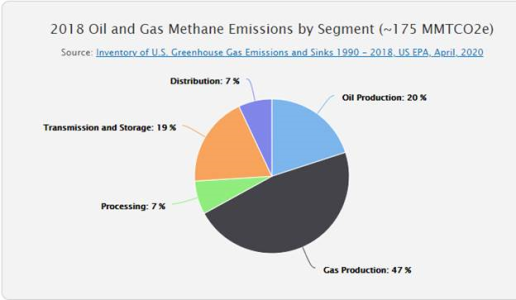
2018 Oil and Gas Methane Emissions by Segment (~175 MMTCO2e) ( ) (Methane )
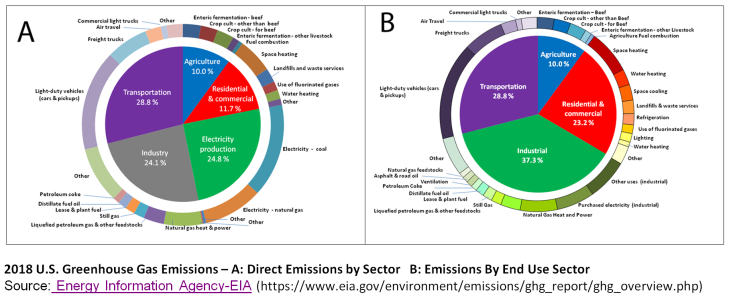
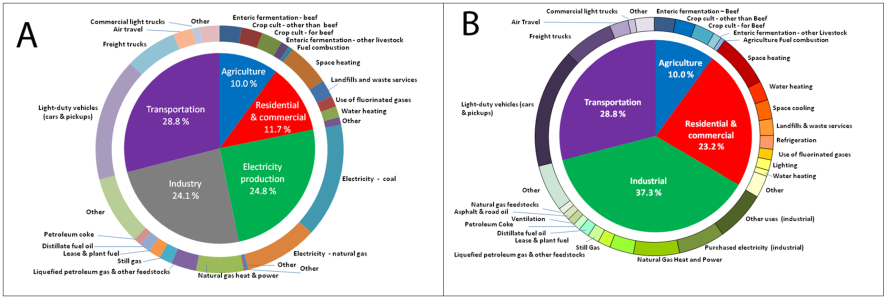
 | 2018 U.S. Greenhouse Gas Emissions – A: Direct Emissions by Sector B: Emissions By End Use Sector ( ) (Greenhouse Gases Energy )
 | Annotated
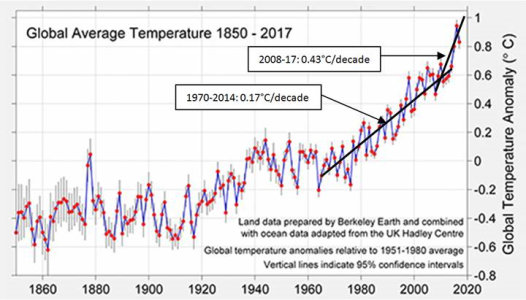
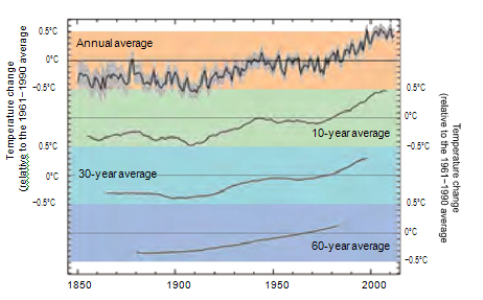
Global Average 1850-2017 (TempAnnotated AnnotatedGlobalAverage1850_2017) (temperature)
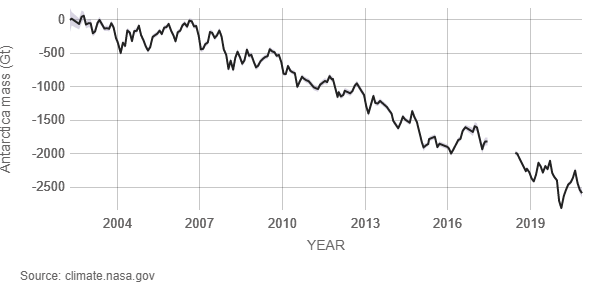
 | Antarctic ice melt is twice as fast as ten years ago (AntarcticMeltFaster ) (Antarctic Sea Level)
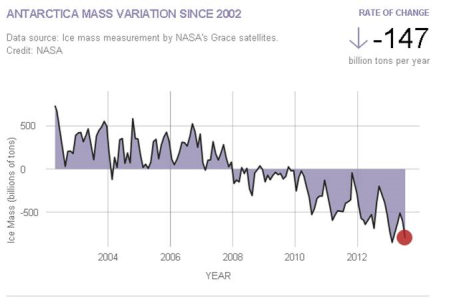 |
Antarctica Ice Cap Mass 2002-2020 (relative to 2002) ( ) (Arctic Antarctic )
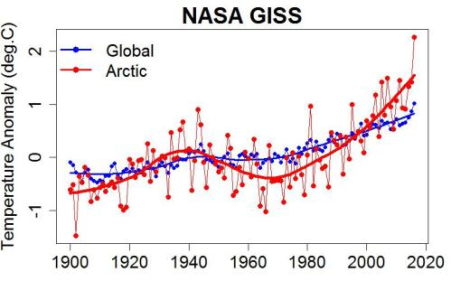
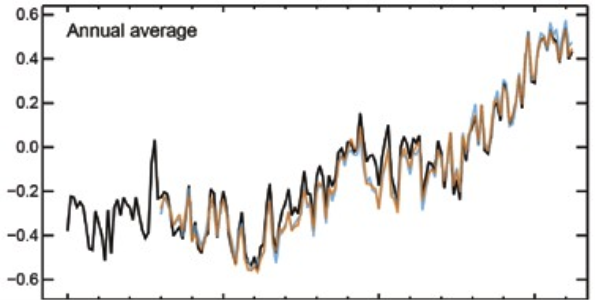
 | Arctic and Global Temperature Anomoly (ArtcicGlobalTemp ) (Arctic Temperature)
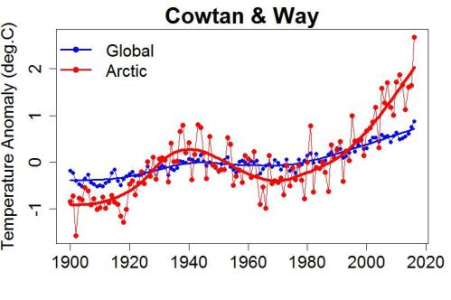
 | Arctic and Global Temperature Anomoly - Cowtan & Way (ArtcicGlobalTempCont ) (Arctic Temperature)
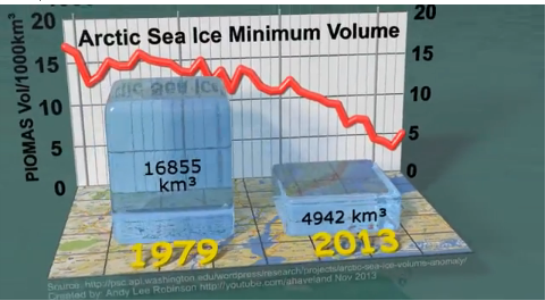
 | Arctic Ice Volume in September - 1979-2013 (AMinIce ArcticMinIceVolume) (Arctic)
 |
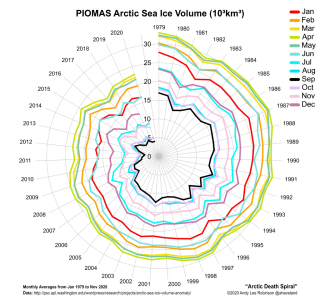
Arctic Sea Ice Death Spiral (ADS Arctic Ice Death Spiral) (Arctic)
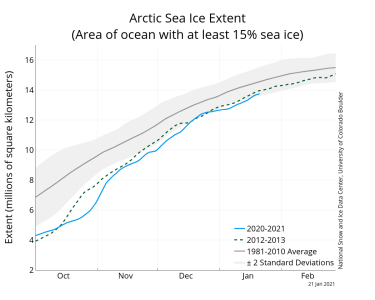
 | Arctic Sea Ice Extent (ASIE Arctic Sea Ice Extent) (Arctic)
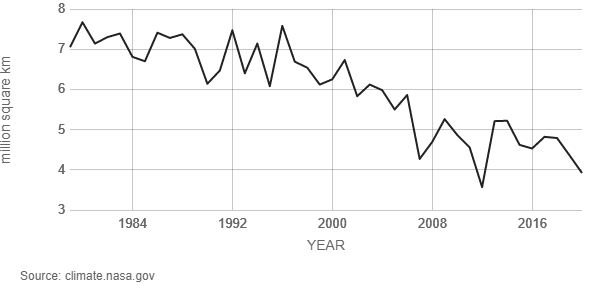
 | Arctic Sea Ice Extent 1979-2020 ( ) (Arctic Sea ice )
 | Arctic Sea Ice Extent Ananoly - Nov 2016 ( ) (Arctic)
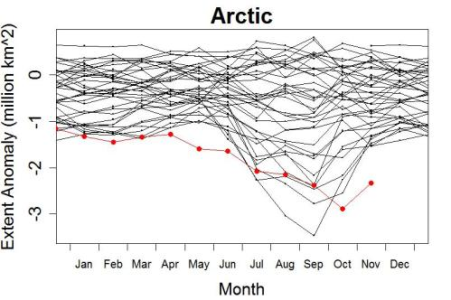 |
Arctic Sea Ice Extent Minimum 1979-2019 (relative to 1979) ( ) (Arctic Sea ice )
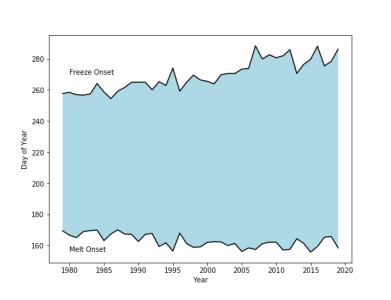
 | Arctic Sea Ice Melt Season 1979-2020 ( ) (Arctic Sea ice )
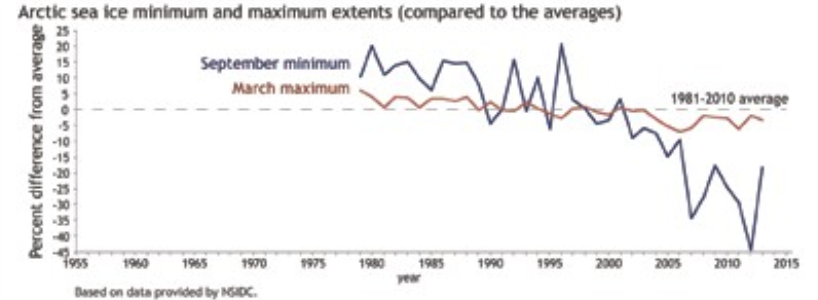
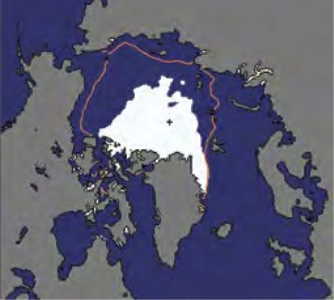
 | Arctic Sea Ice Minimum and Maximum Extents (compared to the averages) (NAS01A ) (Arctic)
 | Arctic Sea Ice Volume 1979-2020 ( ) (Arctic Sea ice )
 |
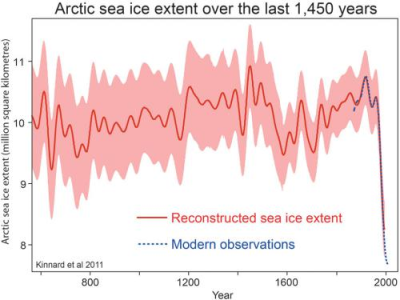
Artcic sea ice extent for the last 1,450 years (ArcticSeaIce1450Yrs ) (Arctic)
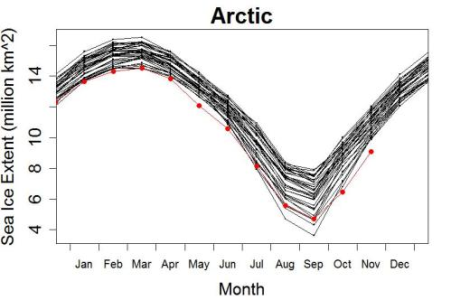
 | Artcic Sea Ice Extent Through Nov 2016 (ArcticSeaIce201611 ) (Arctic)
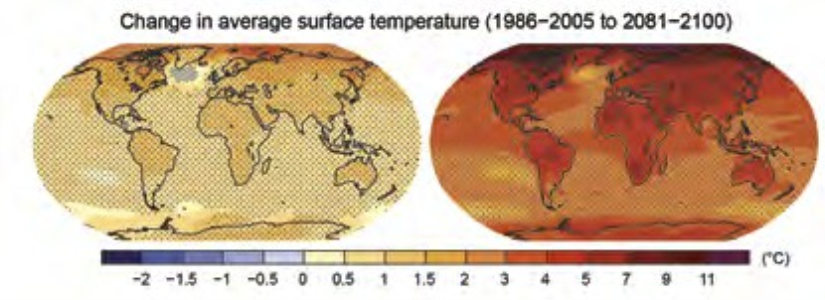
 | Change in average surface temperature (1986-2005 and 2081-2100) (SurfTemp2100 ) (Temperature)
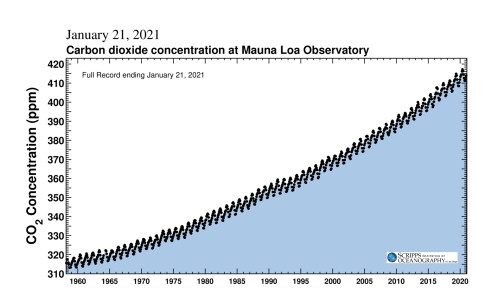
 | CO2 Concentration at Mona Loa Observatory Since 1959 (MLCO2From1959 MonaLoaCO2From1959) (Carbon Dioxide)
 |
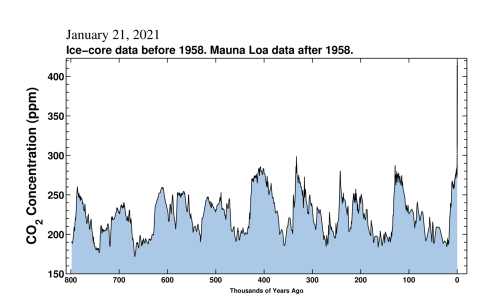
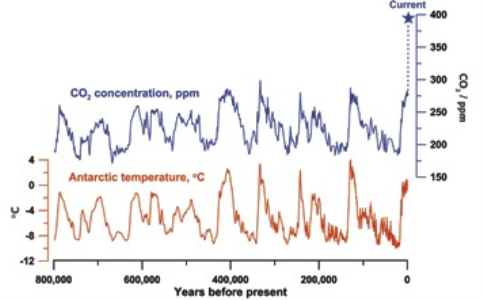
CO2 Concentrations Last 800,000 Years (CO2From800K CO2From800KYearsAgo) (Carbon Dioxide Paleoclimate)
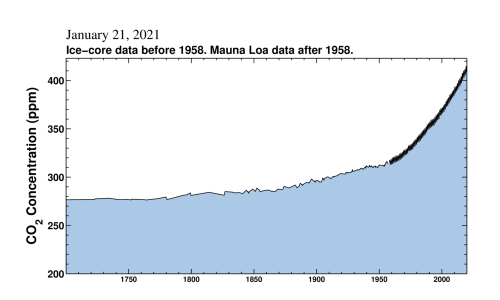
 | CO2 Concentrations Since 1700 (CO2From1700 CO2From1700) (Carbon Dioxide)
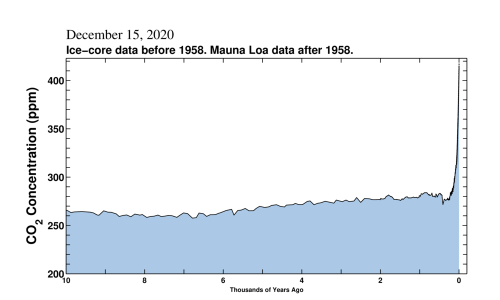
 | CO2 Levels for Last 10000 Yerars (Mauna Loa) (CO2Last10KYears ) (Carbon Dioxide)
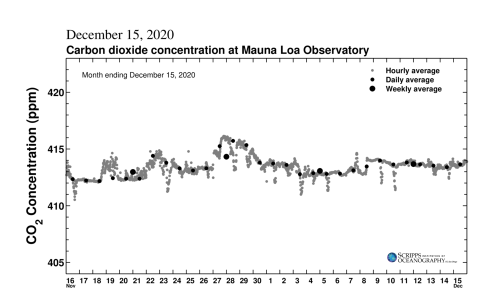
 | CO2 Levels for Previous Month (Mauna Loa) (CO2PrevMonth ) (Carbon Dioxide)
 |
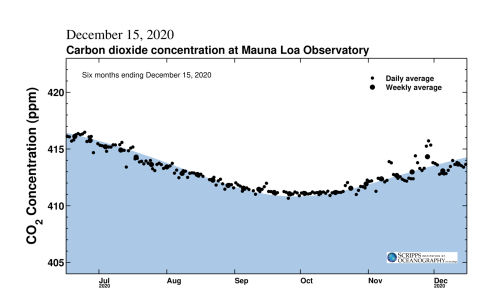
CO2 Levels for Previous Six Months (Mauna Loa) (CO2PrevSixMonths ) (Carbon Dioxide)
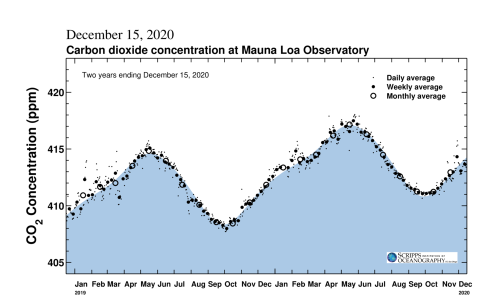
 | CO2 Levels for Previous Two Years (Mauna Loa) (CO2PrevTwoYears ) (Carbon Dioxide)
 | CO2 Levels for Since 1700 (Mauna Loa) (CO2Since1700 ) (Carbon Dioxide)
| CO2 Levels for Since 1958 (Mauna Loa) (CO2Since1958 ) (Carbon Dioxide)
|
Conclusions (Conclusions ) ()
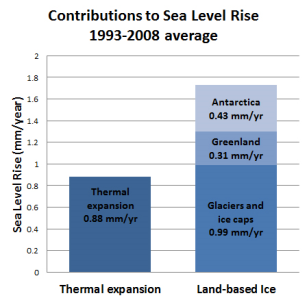
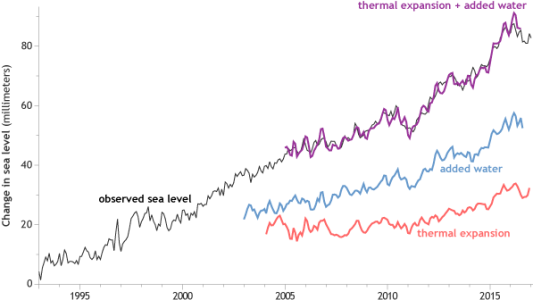
| Contributions to Sea Level Rise (1993-2008 Average) (SeaLevelContributors ) (Sea Level)
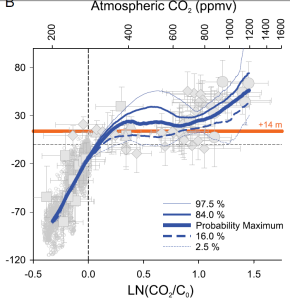
 | Cross-plot of estimates of atmospheric CO2 and coinciding sea level (AtmosCO2VsSeaLevel ) (Carbon Dioxide sea level Paleoclimate)
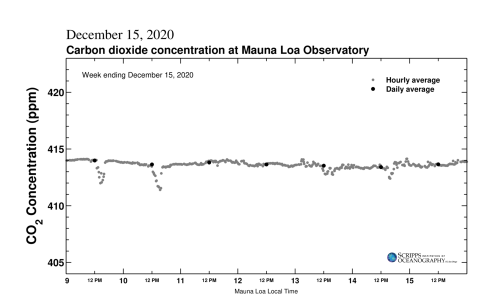
 | Current CO2 Levels (Mauna Loa) (CO2Current ) (Carbon Dioxide)
 |
Does the rate of warming vary from one decade to another? (NAS09 ) (Weather)
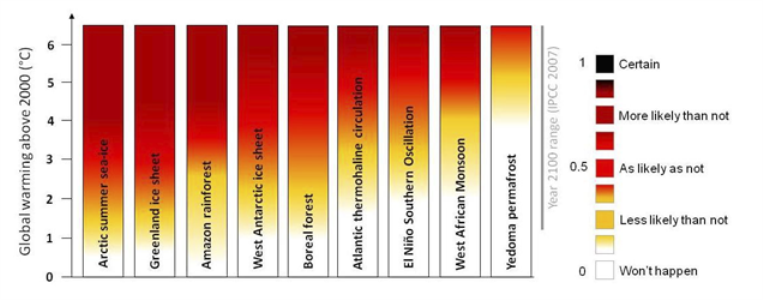
 | Earth System Tipping Points (TipPts ) (Tipping)
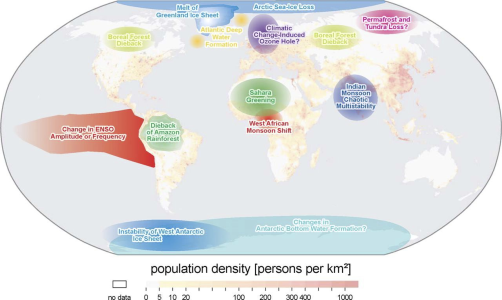 | Earth System Tipping Points Liklihood (TipPtsLike ) (Tipping)
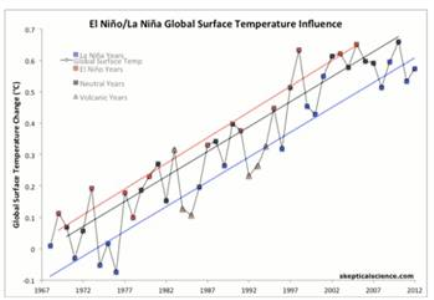
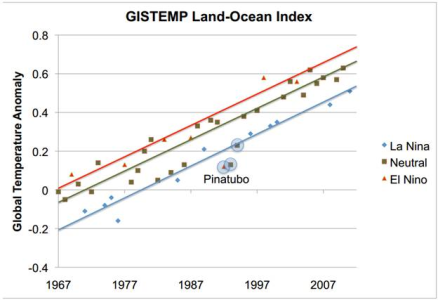
 | El Niño/La Niña Global Surface Temperature Influence - 1967-2012 (ElNinoTemp ) (Temperature)
 |
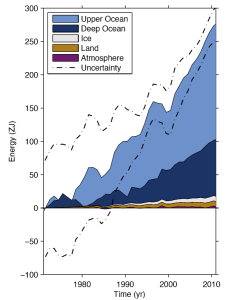
Energy absorbed by the Earth 1970-2010 - Most of the heat is going into the oceans (EnrgyAbsorb1970_2010 ) (Temperature Oceans)
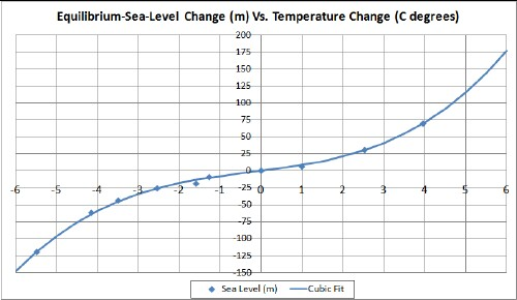
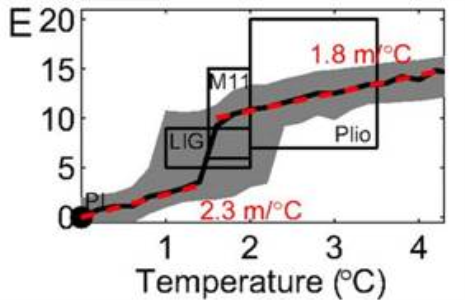
 | Equilibrium sea level change relative to temperature change (EquilSeaLevelVsTemp ) (sea level)
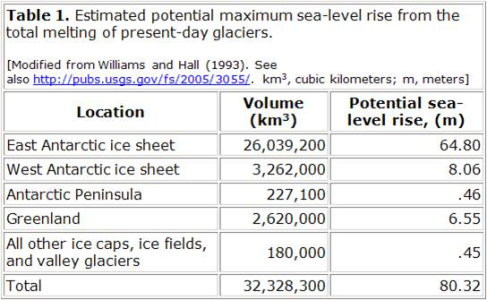
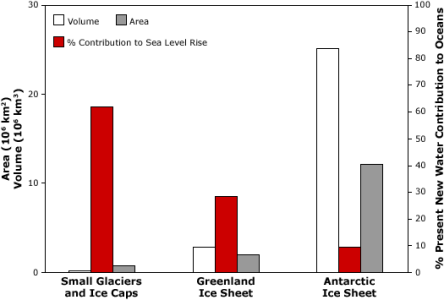
 | Estimated potential maximum sea-level rise from the total melting of present-day glaciers (MaxSLRFromGlaciers ) ( Sea Level Glaciers Greenland Antartica)
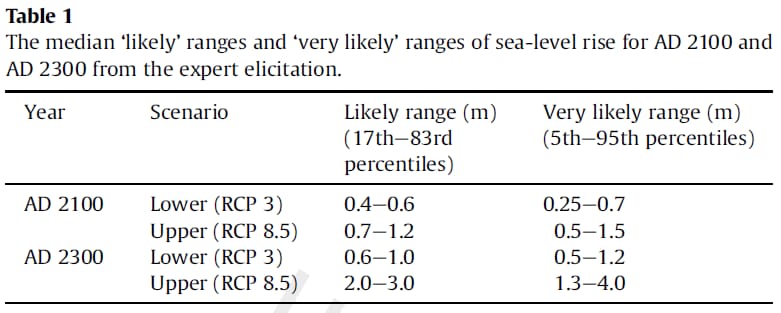
 | Expert range of sea-level rise forecasts for 2100 and 2300 (SLRExperts2300 ) (sea level)
 |
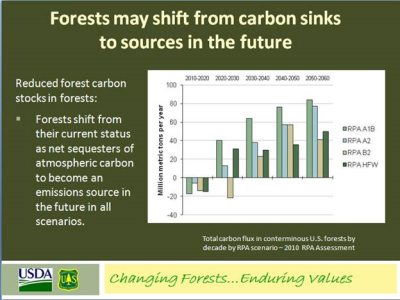
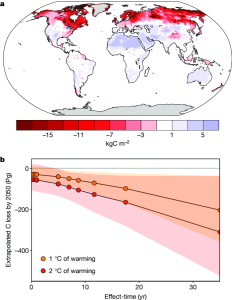
Forests man shift from sinks to sources (ForestSinkToSource ) (Forests)
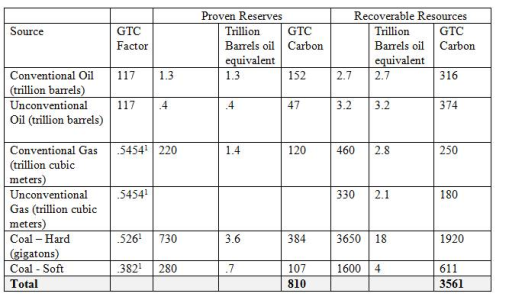
 | Fossil Fuel Reserves (FossilFuelReserves ) (Fossil Fuel)
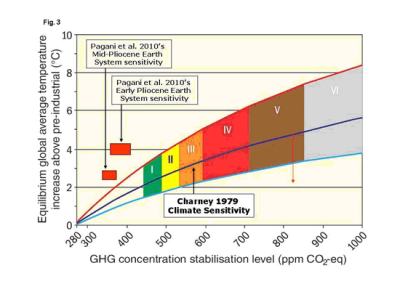
 | GHG Concentration Stabilization Level vs Average Temperature Increase (Charney ) (GHG Temperature Carbon Dioxide)
 | Global
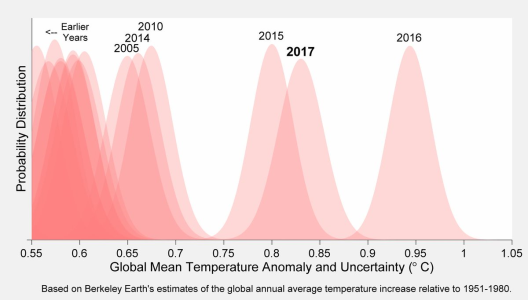
Mean Anomaly (TempThreeYears ) (temperature)
 |
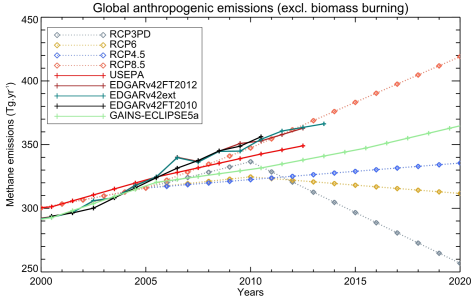
Global anthropogenic emissions (excl. biomass burning) (GlobMethane02 ) (Methane)
 | Global Average (Land) Temperature 1975-1979 (relative to 1880-1920 climatology): ( ) (Temperature )
 | Global Average (Land) Temperature 2016-2020 (relative to 1880-1920 climatology): ( ) (Temperature )
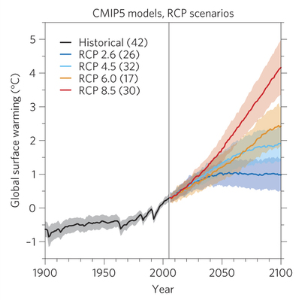
 | Global average surface temperature rise for the four RCPs (TempAllRCPs ) (temperature)
 |
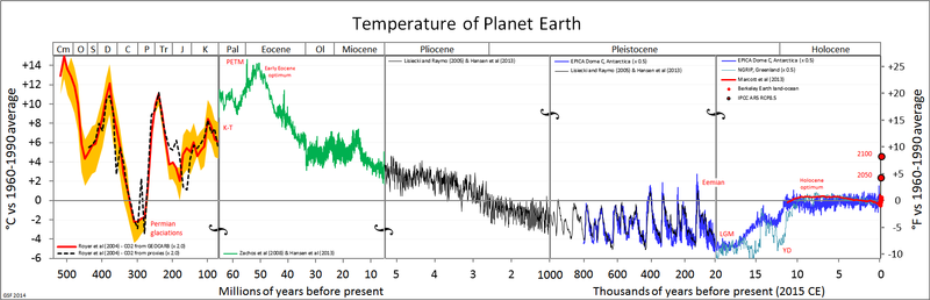
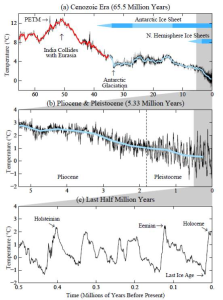
Global average temperature estimates for the last 540 My (TempLast540MY ) (Temperature)
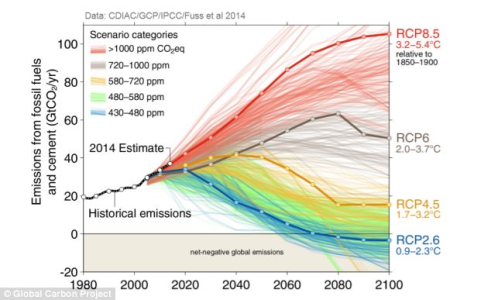
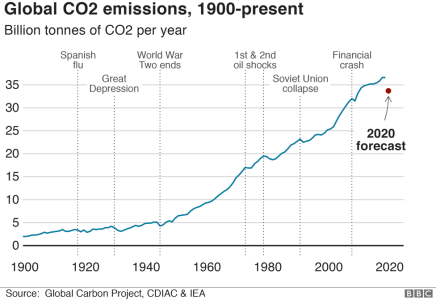
 | Global CO2 Emissions - Projected vs Actual (through 2014) (GlobalCO2Thru2014 ) (Carbon Dioxide)
 | Global CO2 of emissions 1990-2020 ( ) ()
 | Global Deep Open Temperatures Last 65 Million years (DeepOceanTemps65Myrs ) (Temperature)
 |
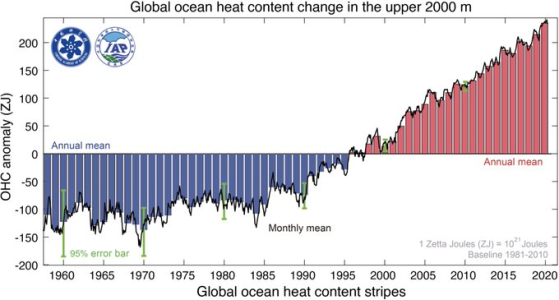
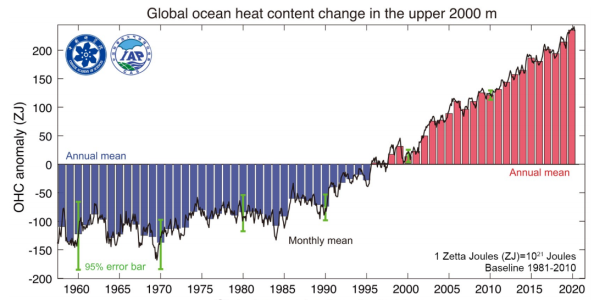
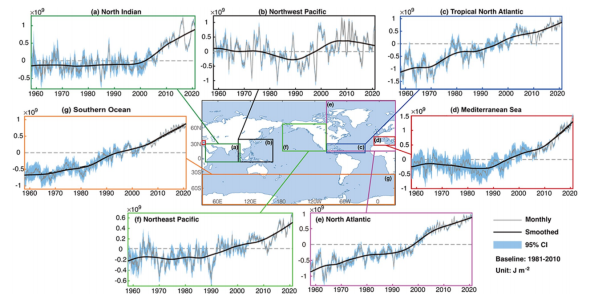
Global Ocean Heat Content 1979-2020 (relative to 1981-2010) ( ) (Sea Level Oceans )
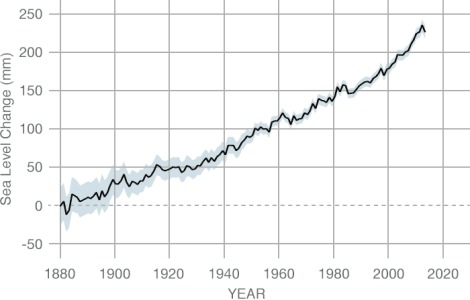
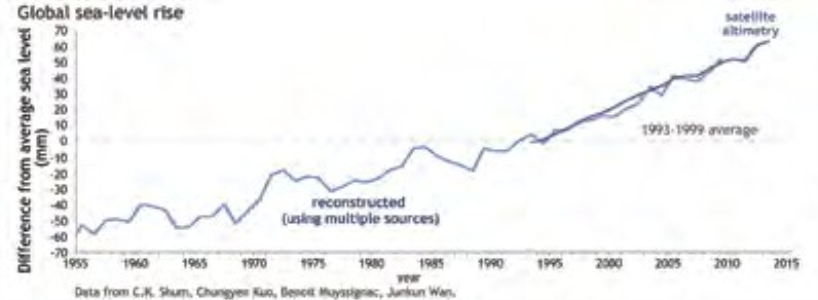
 | Global Sea-level Rise 1960-2013 (NAS01C ) (Sea Level)
 | Global Soil Carbon (SoilCarbon ) (Soil Carbon)
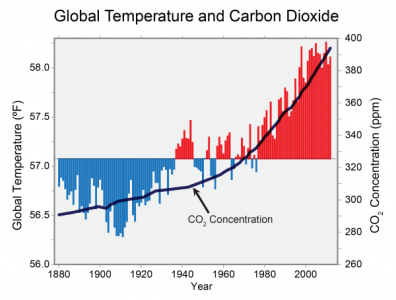
 | Global Temperature and Carbon Dioxide - 1880-2012 (GTCO2 GlobalTempAndCO2) (Temperature Carbon Dioxide)
 |
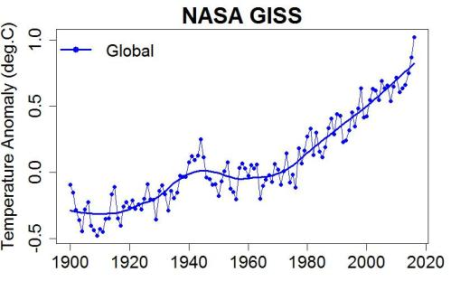
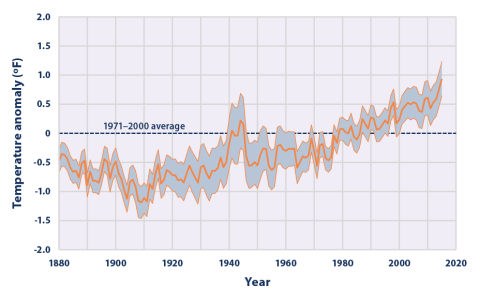
Global Temperature Anomoly (Global Temp ) (Temperature)
 | Global temperature with trends for El Niño (ElNinoTempInfluence ElNinoTempInfluence) (Temperature)
 | Global upper 2000 m ocean heat content from 1958 through 2020 ( ) (Oceans )
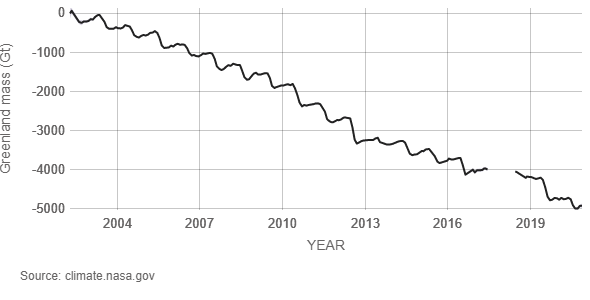
 | Greenland Ice Cap Mass 2002-2020 (relative to 2002) ( ) (Greenland )
 |
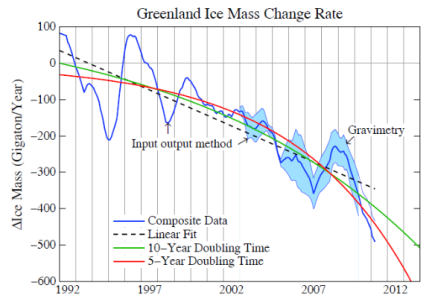
Greenland Ice Sheet Mass 1992 - 2012 (GrnlandMelt1990_2012 ) (Greenland)
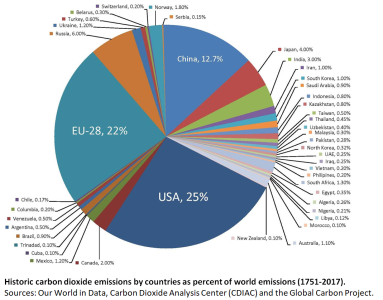
 | Historic carbon dioxide emissions by countries as percent of world emissions (1751-2017). ( ) (Carbon Dioxide Carbon Dioxide )
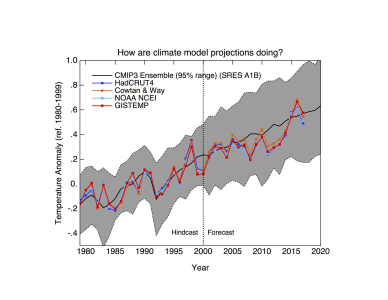
 | How are climate
model projections doing? (TempModels
HowAreModelProjectionDoing) (temperature;models)
 | How confident are scientists that Earth will warm further over the coming century? (NAS16 ) (Warming)
|
How fast is sea level rising? (NAS14 ) (Sea level)
 | If emissions of greenhouse gases were stopped, would the climate return to the conditions of 200 years ago? (NAS20 ) (Carbon Dioxide Methane)
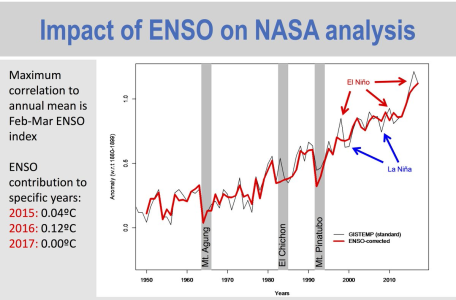
 | Impact of ENSO
on NASA analysis (TempEnso
ImpactofENSOonTemps) (temperature)
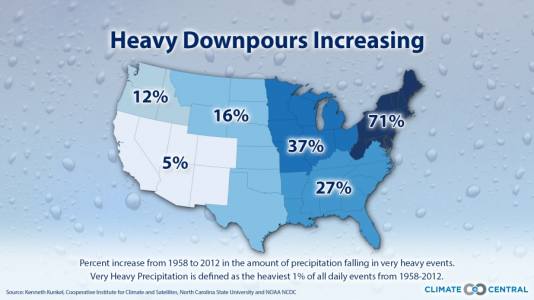
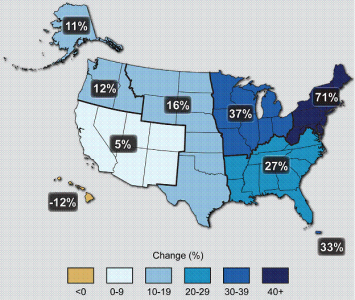
 | Increase in Extreme Precipitation Events 1958-2012 (IncrExtremePrecip ) (Atmosphere Weather)
 |
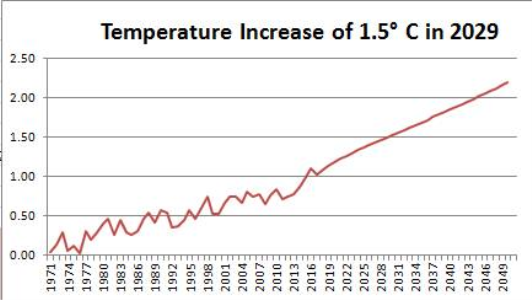
increase of
1.5° C in 2029 (Temp15In2029 ) (temperature)
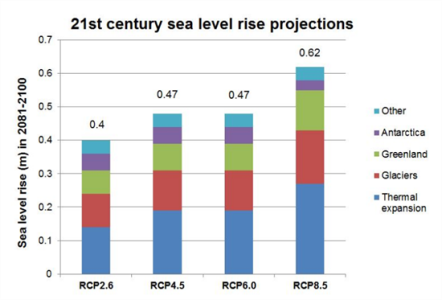
 | IPCC Sea Level 2100 - All Scenarios (IPCCSeaLevel ) (Sea Level)
 | Is the climate warming? (NAS01 ) (Temperature)
 | Is the current level of atmospheric CO2 concentration unprecedented in Earth’s history? (NAS07 ) (Atmosphere Carbon Dioxide Paleoclimate)
 |
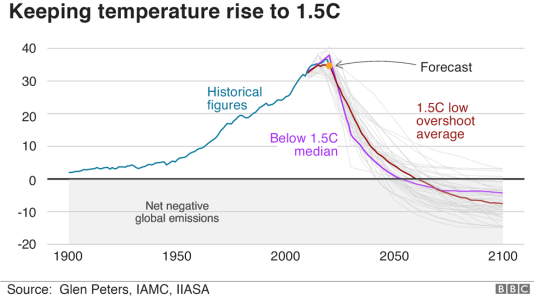
Keeping the Temperature Rise to 1.5° C ( ) (Temperature Climate Energy )
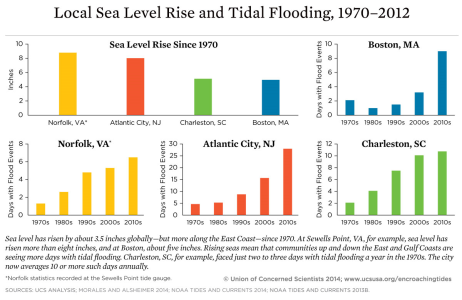
 | Local Sea Level Rise and Tidal Flooding, 1970–2012 (Boston, MA; Atlantic City, NJ; Norfolk, VA; Charleston, SC) (USTidlFlood1970_2012 ) (Sea Level)
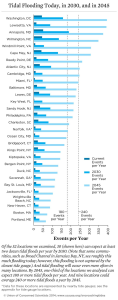
 | Local Sea Level Rise and Tidal Flooding, 1970–2012 (Boston, MA; Atlantic City, NJ; Norfolk, VA; Charleston, SC) (USTidlFlood2013_2045 ) (Sea Level)
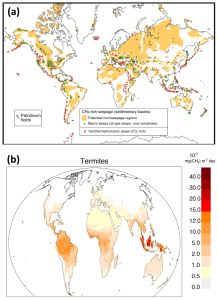
 | Map of areas and locations for geological emissions of methane (GlobMethane04 ) (Methane)
 |
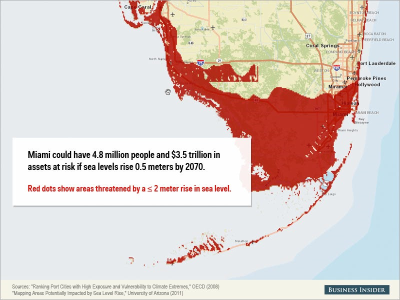
Map of Miami when sea levels rise 2 meters (SLRMiami ) (Sea Level)
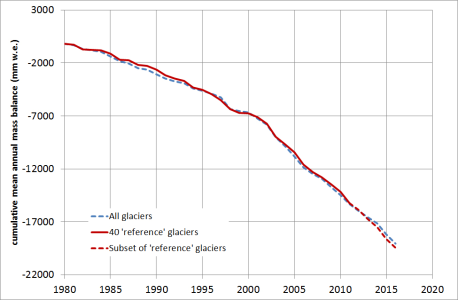
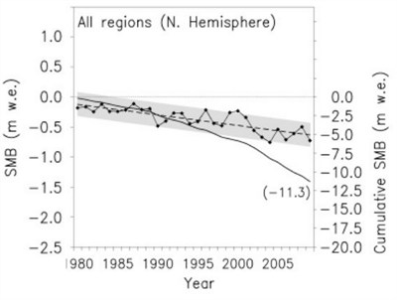
 | Mean cumulative mass balance of all reported glaciers (blue line) and the reference glaciers (red line). (GlacierMass ) (Glaciers Greenland)
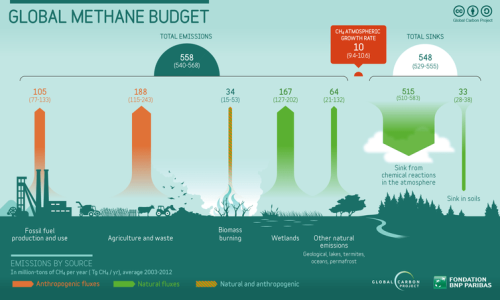
 | Methane Budget (Methane Budget ) (Methane)
 | Methane Concentration (Methane ) (Methane)
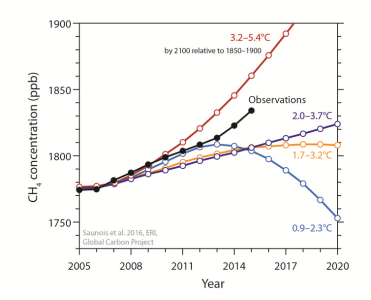 |
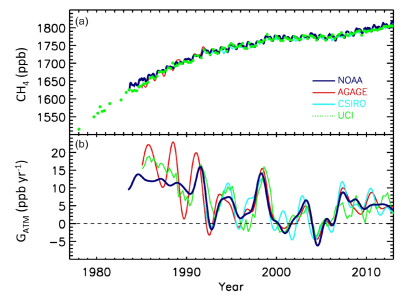
Methane Concentration and Growth Rate (1980-2012) (GlobMethane01 ) (Methane)
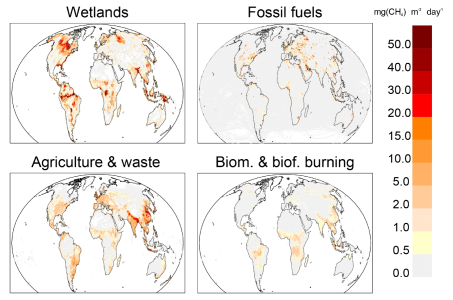
 | Methane emissions from four source categories (GlobMethane03 ) (Methane)
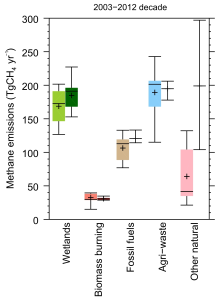
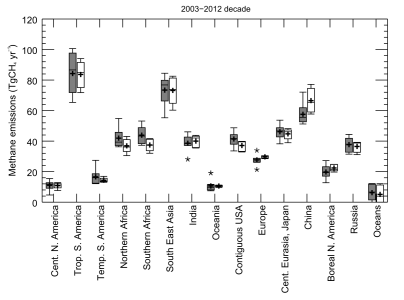
 | Methane global emissions - 2003-2012 decade (GlobMethane05 ) (Methane)
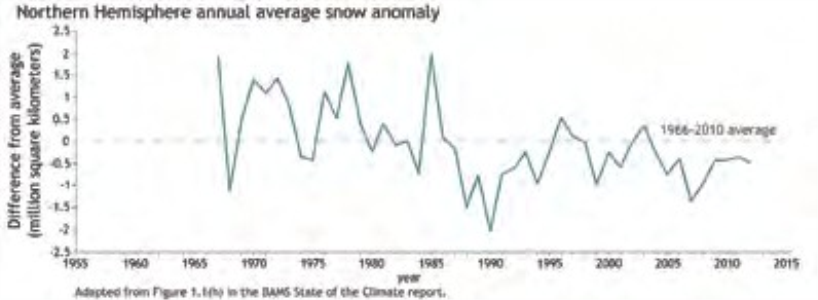
 | Northern Hemisphere annual average snow anomaly (NAS01D ) (Snow)
 |
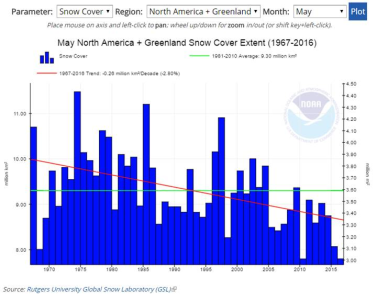
Northern Hemisphere Snow Cover - 1967 to 2016 (NHSC NorthernHemisphereSnowCover) (Snow Cover)
 | Observed Change in Very Heavy Precipitation (HeavyPrecip ) (Weather)
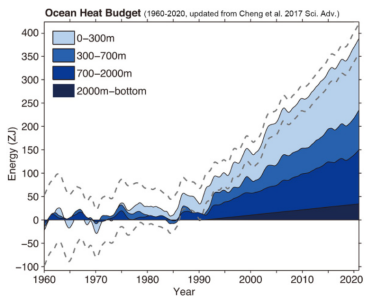
 | Ocean heat budget from 1960 to 2020 ( ) (Oceans )
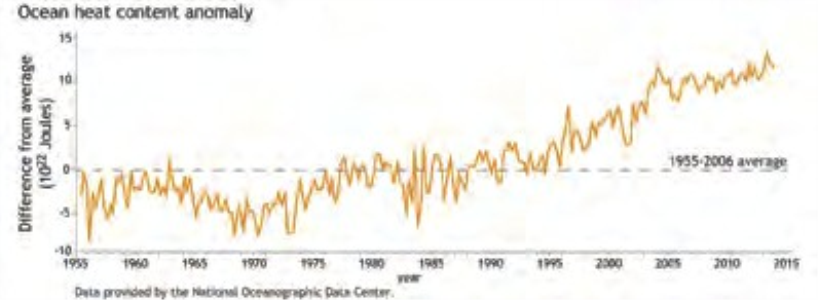
 | Ocean Heat Content Anomaly (NAS01B ) (Oceans)
 |
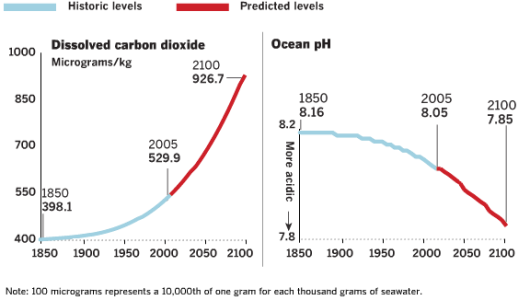
Ocean pH Since 1850 and Projected to 2100 (OceanpH1850_2100 ) (Acidification)
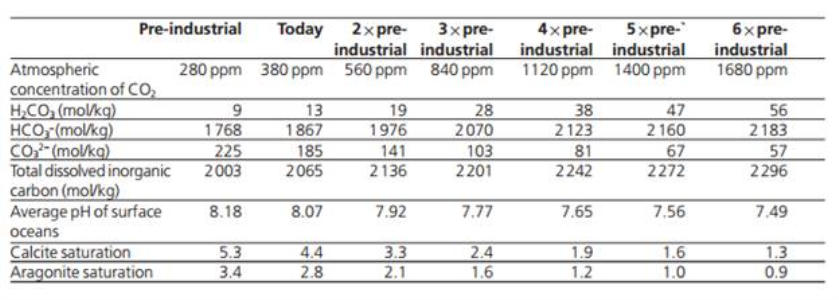
 | Ocean pH vs Atmospheric CO2 PPM (OceanpHvsCO2ppm ) (Acidification)
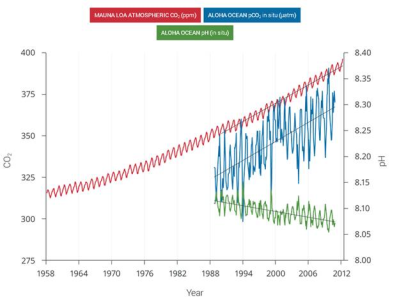
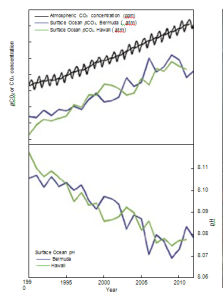
 | Ocean pH vs Atmospheric ppm 1958 to 2012 (OceanpH1958_2012 ) (Acidification)
 | Other ice caps and glaciers in the northern hemisphere are melting faster too (GlacierMelt ) (Glaciers Sea Level)
 |
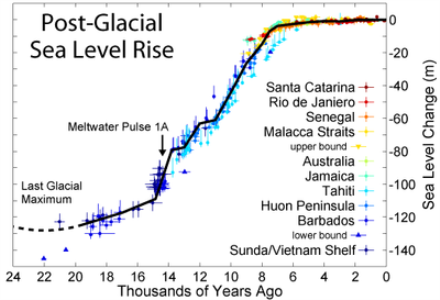
Post Glacial Sea Level Rise (PGSeaLevel PostGlacialSeaLevelRise) (Sea Level Paleoclimate)
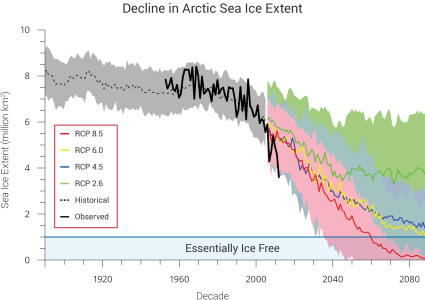
 | Projected Arctic Sea Ice Decline (ArcticSeaIceDecline ) (Arctic)
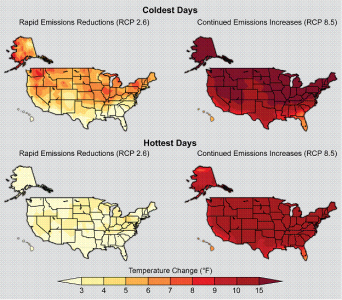
 | Projected Temperature Change of Hottest and Coldest Days (HotAndColdDays ) (Temperature)
 | Radiative forcing and albedo feedback from the Northern Hemisphere cryosphere between 1979 and 2008 (NHRF ) (Snow cover Sea ice)
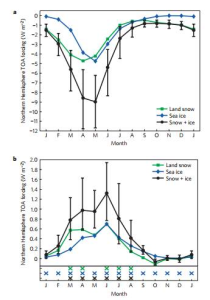 |
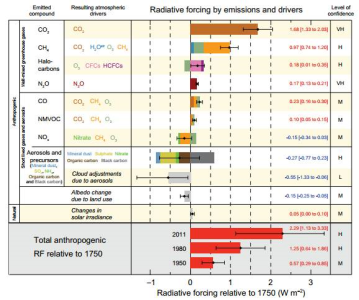
Radiative forcing by emissions and drivers (1750-2011) (RF1750to2011 ) (Snow)
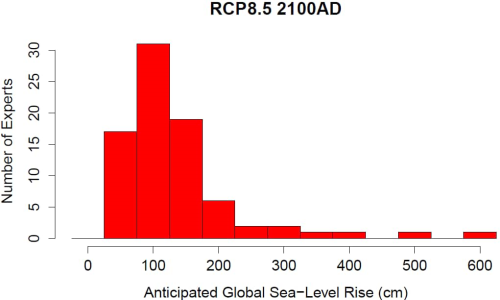
 | RCP 8.5 Sea Level rise expected by experts (RCP8.5ExpertSLR ) (Sea Level)
 | Regional CH4 budget in Tg CH4 yr-1 per category (GlobMethane07 ) (Methane)
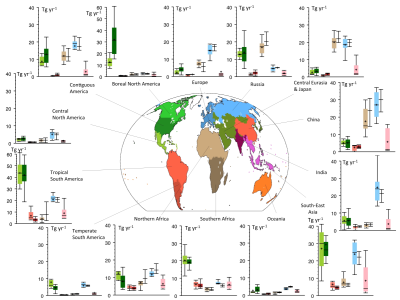 | Regional methane emissions - 2003-2012 decade (GlobMethane06 ) (Methane)
 |
Regional observed upper 2000 m ocean heat content change from 1955 through 2020 ( ) (Oceans )
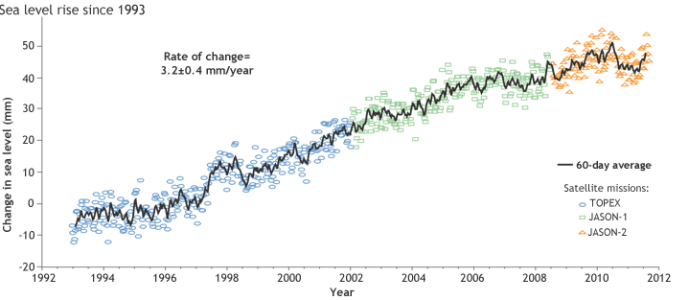
 | Satellite-based estimates of sea level between 1993 and 2011 (NOAA) (SLR1993_2011 ) (Sea Level)
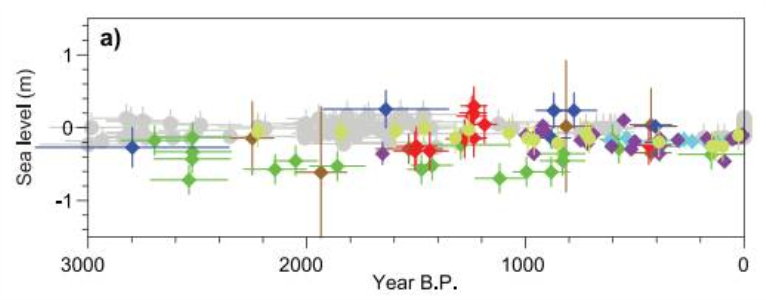
 | Sea Level Last 3000 years from selected sites (SeaLevelLast3000yrs ) (Sea Level)
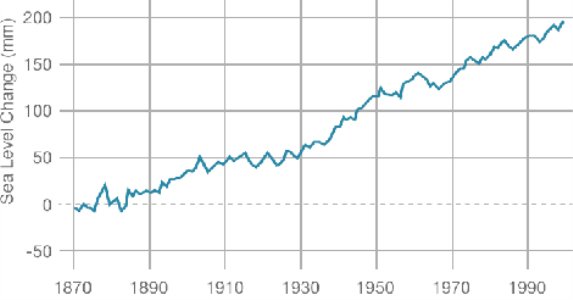
 | Sea Level Rise 1870 to 2000 (Tide Gauges) (SLRTideGauges ) (Sea Level)
 |
Sea level rise contributors (SLRContrib Sea level rise contributors) (Sea level rise Greenland Glaciers Antarctic)
 | Sea Level Rise Due To Thermal Expansion (for next 500 years) (SLRThermal ) (Sea Level)
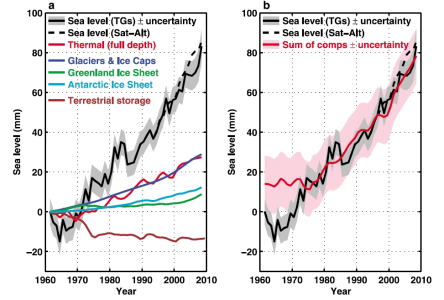
 | Sea level rise for 1961-2008 (by source) (SeaLevel1961-2008 ) (Sea Level)
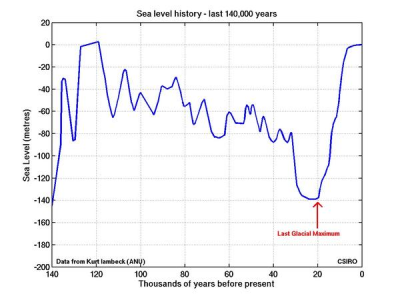
 | Sea Level Rise Last 140,000 years (SLRLast14000yrs ) ()
 |
Sea Surface Temperature - 1880-2012 (SST SeaSurfaceTemperature) (Temperature Oceans)
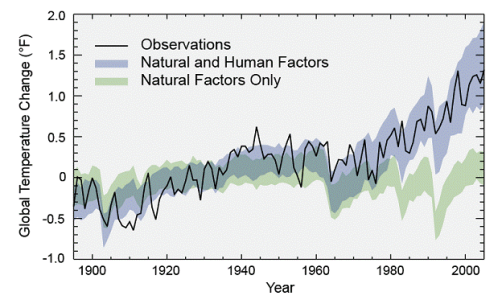
 | Separating Human and Natural Influences on Climate (HumanFactors ) (Human Temperature)
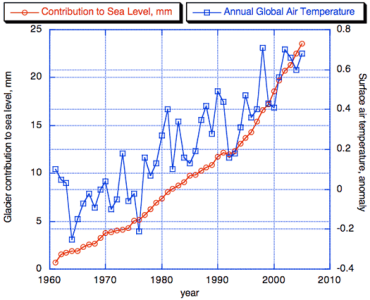
 | Small glacier/ice cap contribution (SmallGlacierContrib Small glacier/ice cap contribution) (Glaciers Sea Level)
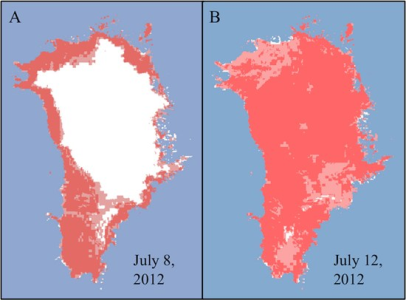
 | Soot from forest fires contributed to unusually large Greenland surface melt in 2012 (GreenlndSurfMelt2012 ) (Greenland Soot Sea Level)
 |
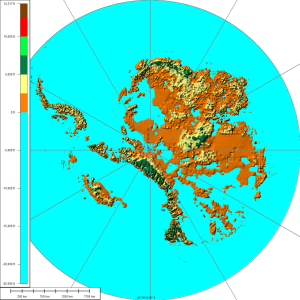
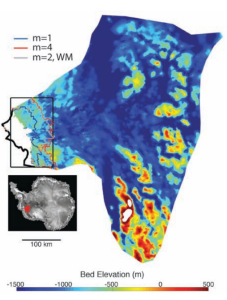
Subglacial topography of Antarctica (AntarticaBedrock ) (Antarctic Sea Level)
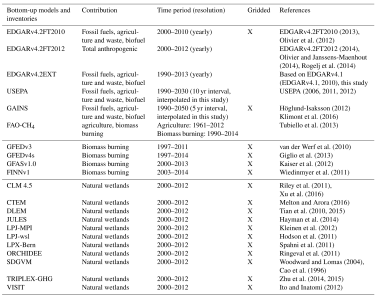
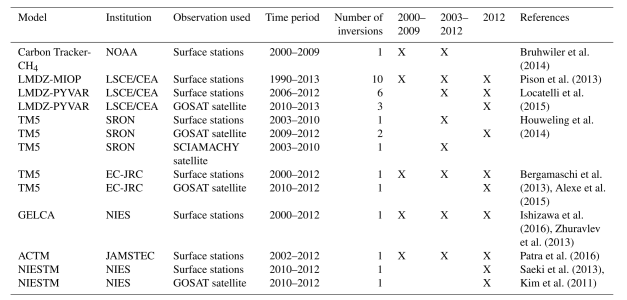
 | Table 1. Bottom-up models and inventories used in this study. (GlobMethane08 ) ()
 | Table 2. Global methane emissions by source type (GlobMethane09 ) ()
 | Table 2.2 | The assessed remaining carbon budget and its uncertainties. ( ) (Methane Temperature Sea ice Permafrost Feedbacks Climate Oceans Oceans Feedbacks )
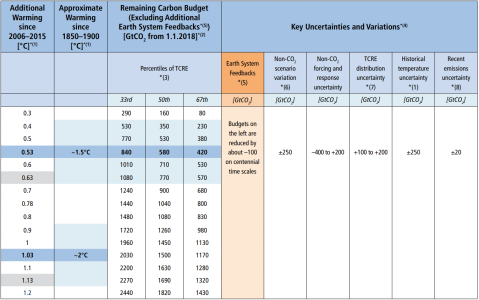 |
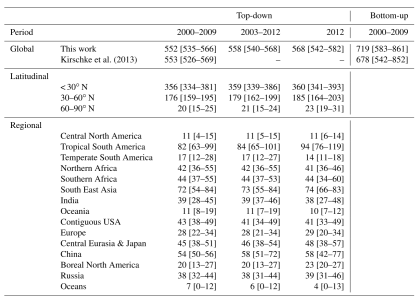
Table 3. Top-down studies (GlobMethane10 ) ()
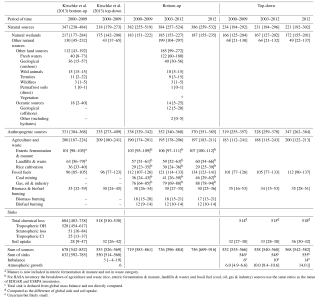
 | Table 4. Global, latitudinal and regional methane emissions (GlobMethane11 ) ()
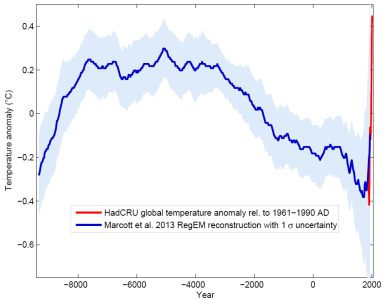
 | Temperature Anomaly Last Ten Thousand Years (HT HoloceneTemperature) (Temperature)
 | Temperature vs Sea Level (TempvsSeaL ) (Temperature Sea Level Paleoclimate)
 |
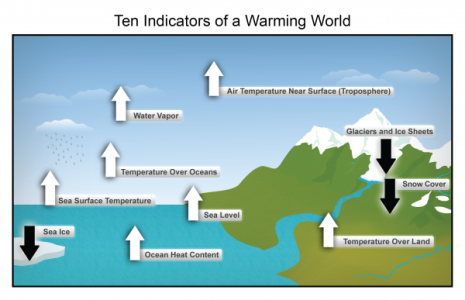
Ten Indicators of a Warming Planet (Indicators Indicators) (Warming)
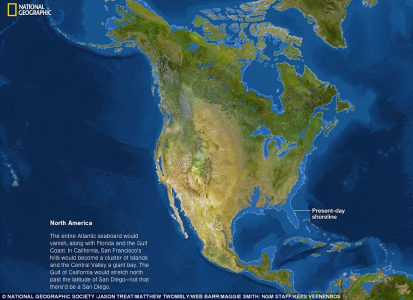
 | The effects of a 80 meter sea level rise on North America (SeaLevelRiseof80M ) (Sea Level)
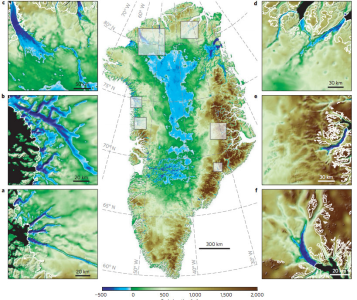
 | The Greenland ice sheet could melt faster than scientists first thought (GreenlndMeltFaster ) (Greenland Sea Level)
 | Total Glacier Ice Decline - 1860-2010 (GV GlacierVolume) (Glaciers)
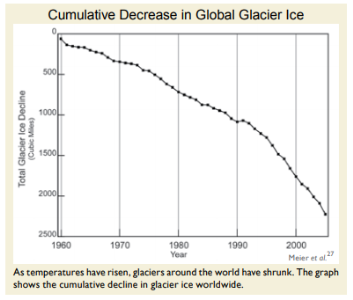 |
Total Glacier Ice Decline - 1860-2010 ( ) (Glaciers )
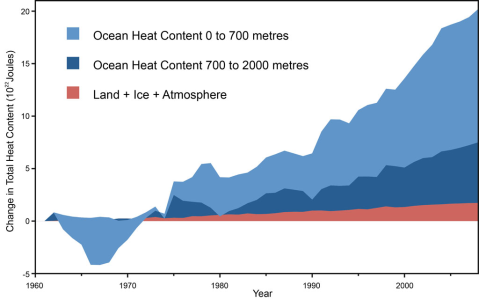
| Total Heat Content (Oceans, Atmosphere, and Land) - 1960-2008 (THC TotalHeatContent) (Oceans Atmosphere Haitus)
 | U.S. greenhouse gas emissions are grouped according to where they were produced (or burned - Figure A) and according to where they were consumed (or used – Figure B). ( ) (Greenhouse Gases Energy )
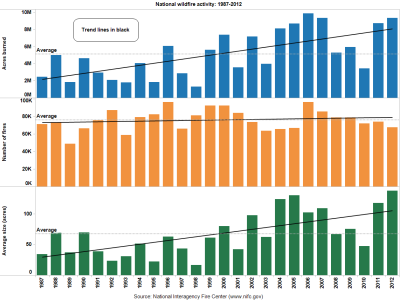
 | US Wildfires 1987-2012 (USFires1987_2012 ) (Weather)
 |
West Antarctic glaciers are collapsing, and it's "unstoppable" (WestAntarticCollapse ) (Antarctic Sea Level)
 | What is ocean acidification and why does it matter? (NAS15 ) (Oceans acidification)
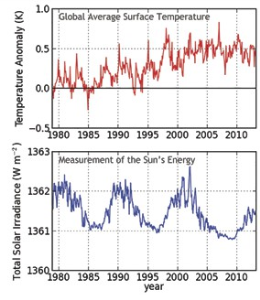
 | What role has the Sun played in climate change in recent decades? (NAS04 ) (Sun)
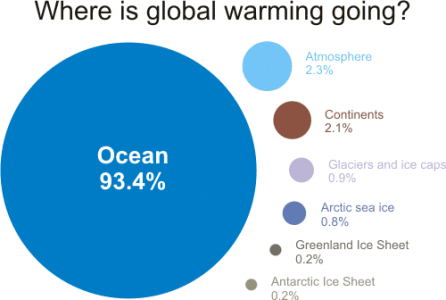
 | Where is global warming going (WhereWarmingGoing ) ()
 |
Why is Arctic sea ice decreasing while Antarctic sea ice is not? (NAS12 ) (Arctic Antarctic)
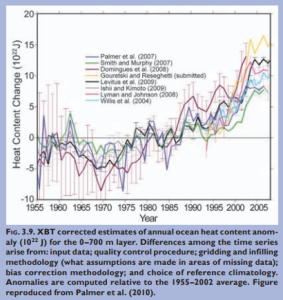
 | World Ocean Heat Content 0-700 m - 1955-2010 (GUOHC GlobalUpperOceanHeatContent) (Oceans)
 | | |
|