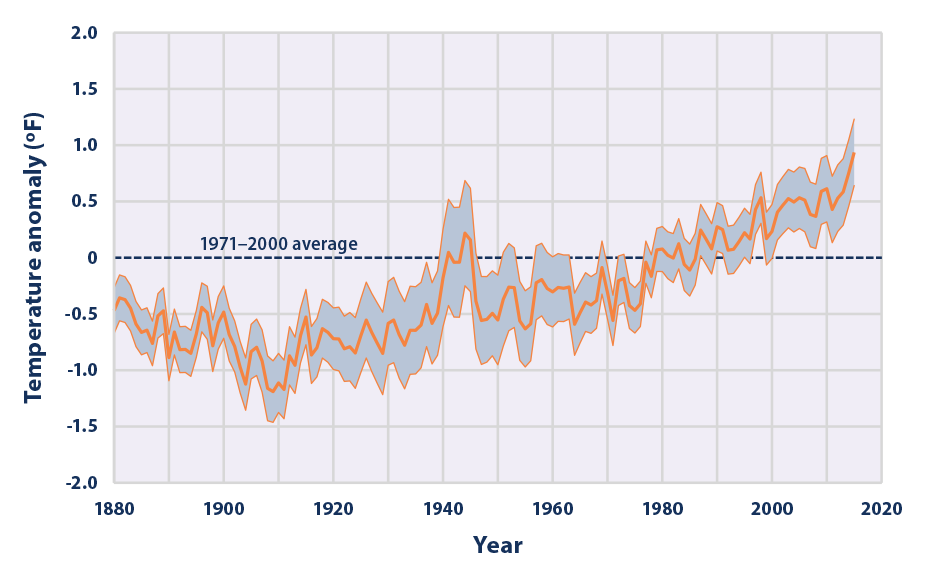
This graph shows how the average surface temperature of the world's oceans has changed since 1880. This graph uses the 1971 to 2000 average as a baseline for depicting change. Choosing a different baseline period would not change the shape of the data over time. The shaded band shows the range of uncertainty in the data, based on the number of measurements collected and the precision of the methods used. | The average surface temperature of the world's oceans has been increasing since about 1910. |