Small glacier/ice cap contribution
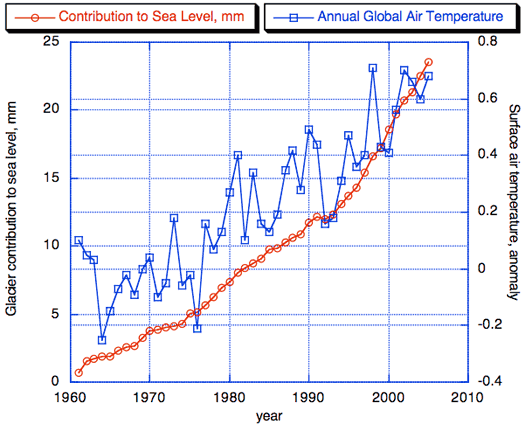
The cumulative contribution to sea level from small glaciers and ice caps (red) plotted with the annual global surface air temperature anomaly (blue). Image courtesy Mark Dyurgerov, Institute of Arctic and Alpine Research, University of Colorado, Boulder. | How glaciers' contribution to sea level is computed
Global mass balance data are transformed to sea-level equivalent by first multiplying the ice thickness (meters) lost to melting by the density of ice (about 900 kilograms per cubic meter), to obtain a water equivalent thickness, and then multiplying by the surface area of these "small" glaciers (about 760,000 square kilometers). This provides an annual average mass balance of approximately -0.273 meters for the period 1961 to 2005. When dividing the mass balance value by the surface area of the oceans (361.6 million square kilometers), the final result is 0.58 millimeters of sea level rise per year. The Glacier Contribution to Sea Level graph demonstrates how the contribution from melting glaciers began increasing at a faster rate starting in the 1990s. This is in agreement with high-latitude air temperature records. The IPCC (2013) stated that it was "very likely" (at least 90 percent confidence) that the mean annual global rate of ocean level increase was 1.5 to 1.9 millimeters between 1901 and 2010, 1.7 to 2.3 millimeters between 1971 and 2010, and 2.8 to 3.6 millimeters between 1993 and 2010. |