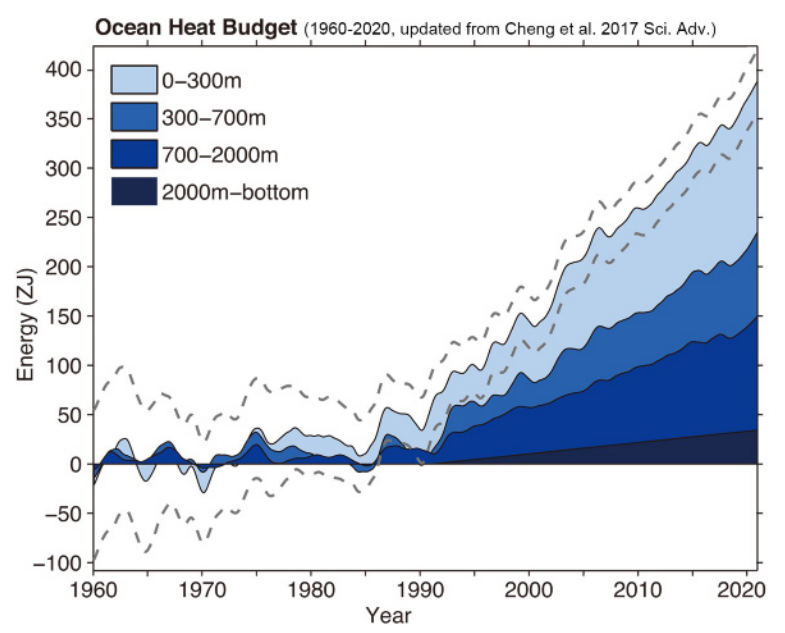
Fig. 2. Ocean heat budget from 1960 to 2020 based on IAP analysis data from 0 to 2000 m, and from Purkey and Johnson (2010) for deep ocean change below 2000 m (units: ZJ). Figure updated from Cheng et al. (2017). The anomalies are relative to 1958-62 baseline, and the time series are smoothed by LOWESS (locally weighted scatterplot smoothing) with span width of 24 months. The gray dashed lines are the 95% confidence interval of the total ocean heat budget. |